Automation
Overview
Automation is an integral part of the entire IR process. By assembling built in nodes, it can enable you to create automation easily. It serves these major functionalities
- detections ingestion
The ETL pipeline enables you to load detections from application and perform ETL operations such as normalization
- enrichment
As part of the investigation, this enables you to pull data from other platform such as VirusTotal to enrich your detections.
- response
This enables you to respond to detections by taking actions on your applications automatically.
- end to end security investigation and response
This is the combination of loading detections, performing analysis and automatically resolve them with your decisions logic.
- security control validation
This enables you to connect to your application to make sure security configurations are effective all the time.
Automation contains three big components as explained in following table :
- workflow
- node
- playbook
| Terminology | Explanation |
|---|---|
| workflow | Running automation in your environment |
| node | Built in integrations with your application |
| playbook | Automation template that you can use |
Workflow has a list of built in nodes that allow you to drag and drop to create your own investigation and response plan within minutes.
To build your own workflow, you need to know :
- How to Create a workflow.
- How to configure Third Party Nodes inside a workflow.
Create First Workflow
Create a workflow
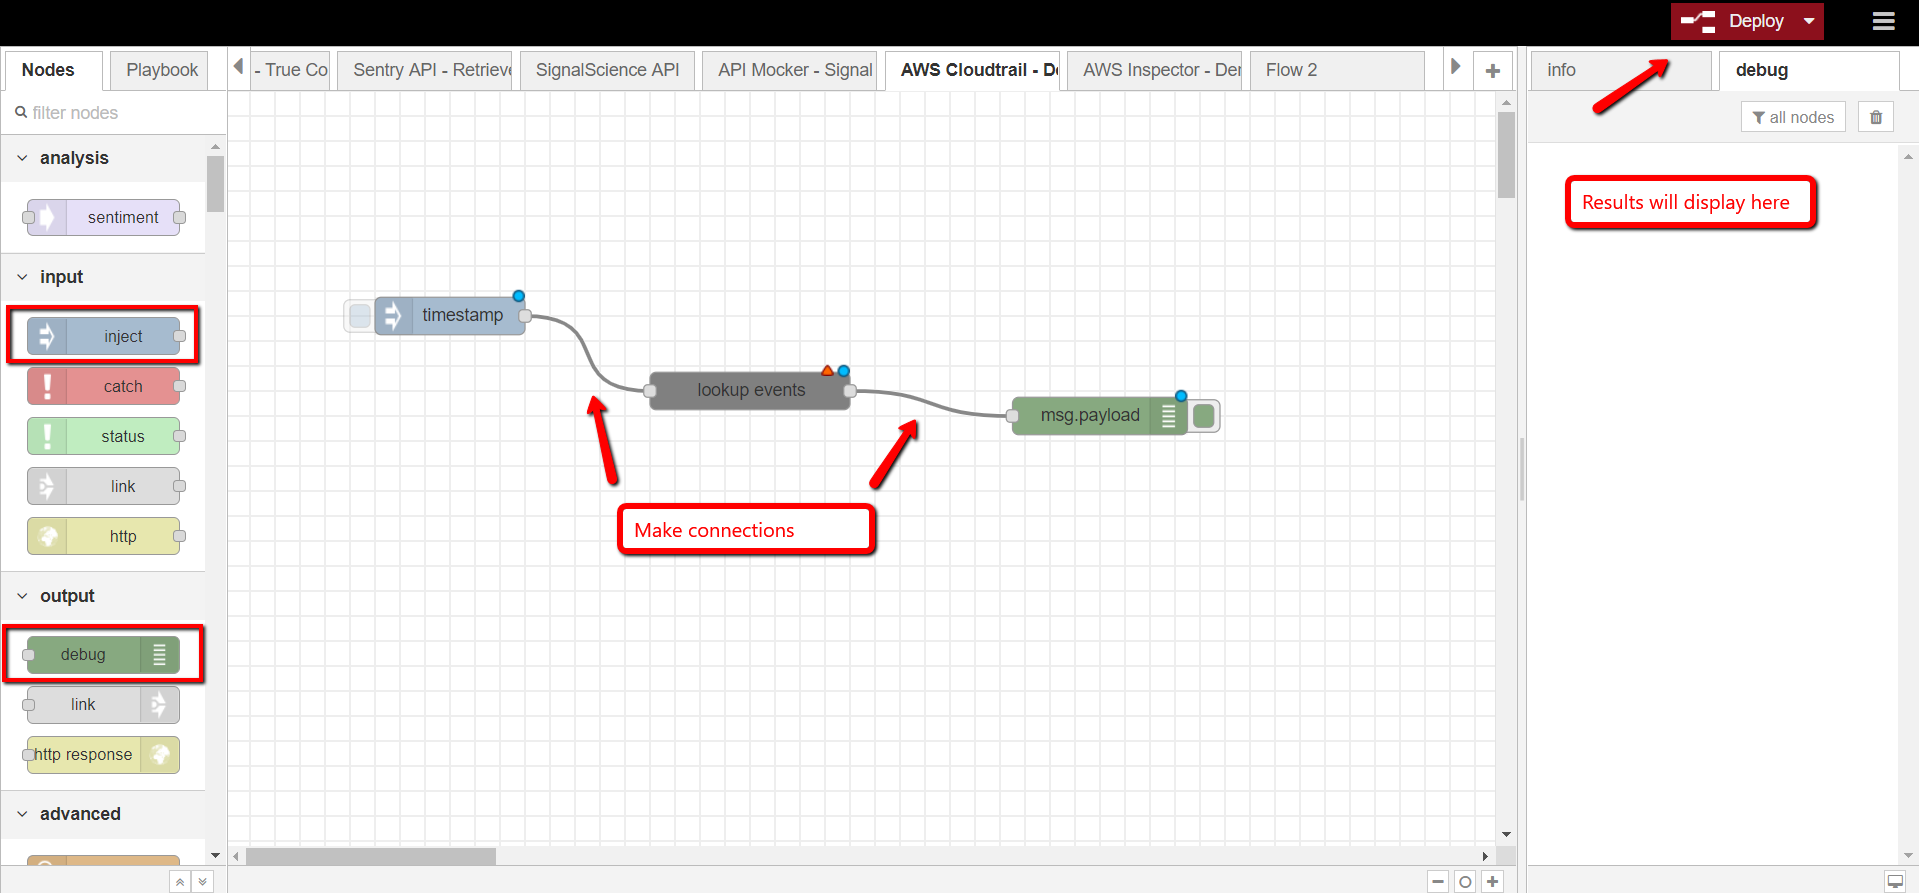
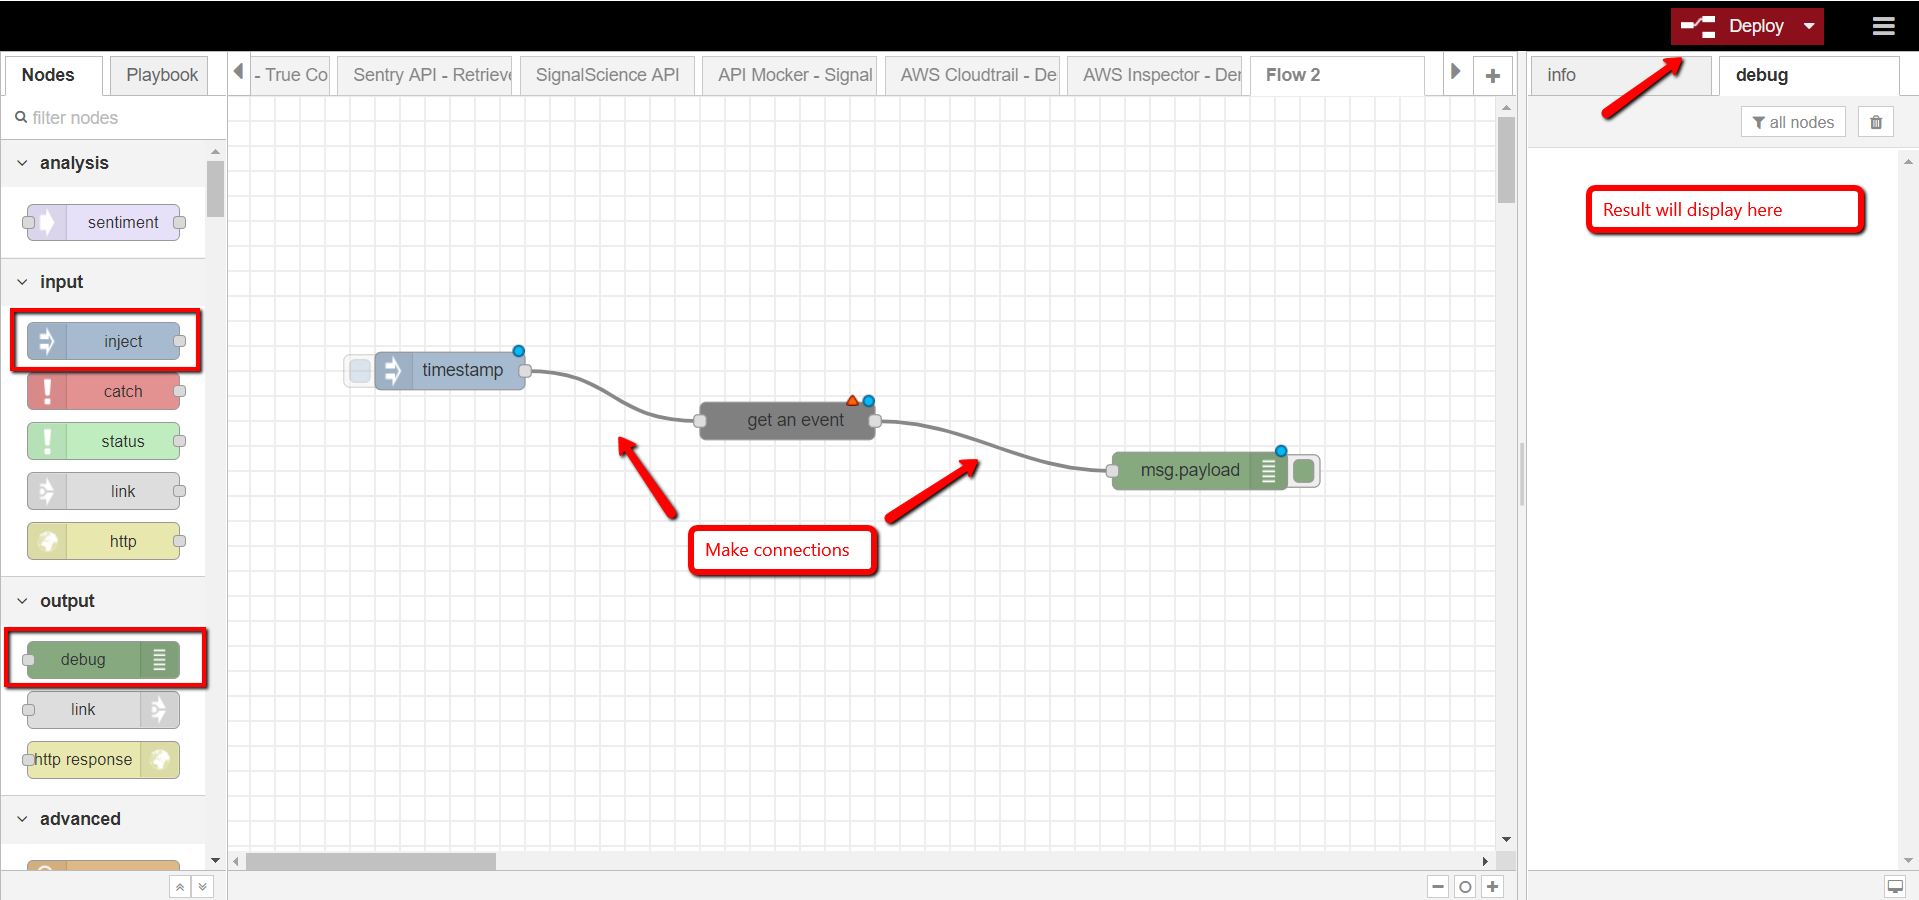
To create a workflow, we are going to need at least two Generic Nodes, one input to trigger, one output to display the result, and function nodes to handle logic between.
There are two main nodes we support that allow you to trigger the automation pipeline.
inject
Inject is good for trigger automation manually or repetitively
http
http node allows you to create an end point which can be triggered by other functionalities.
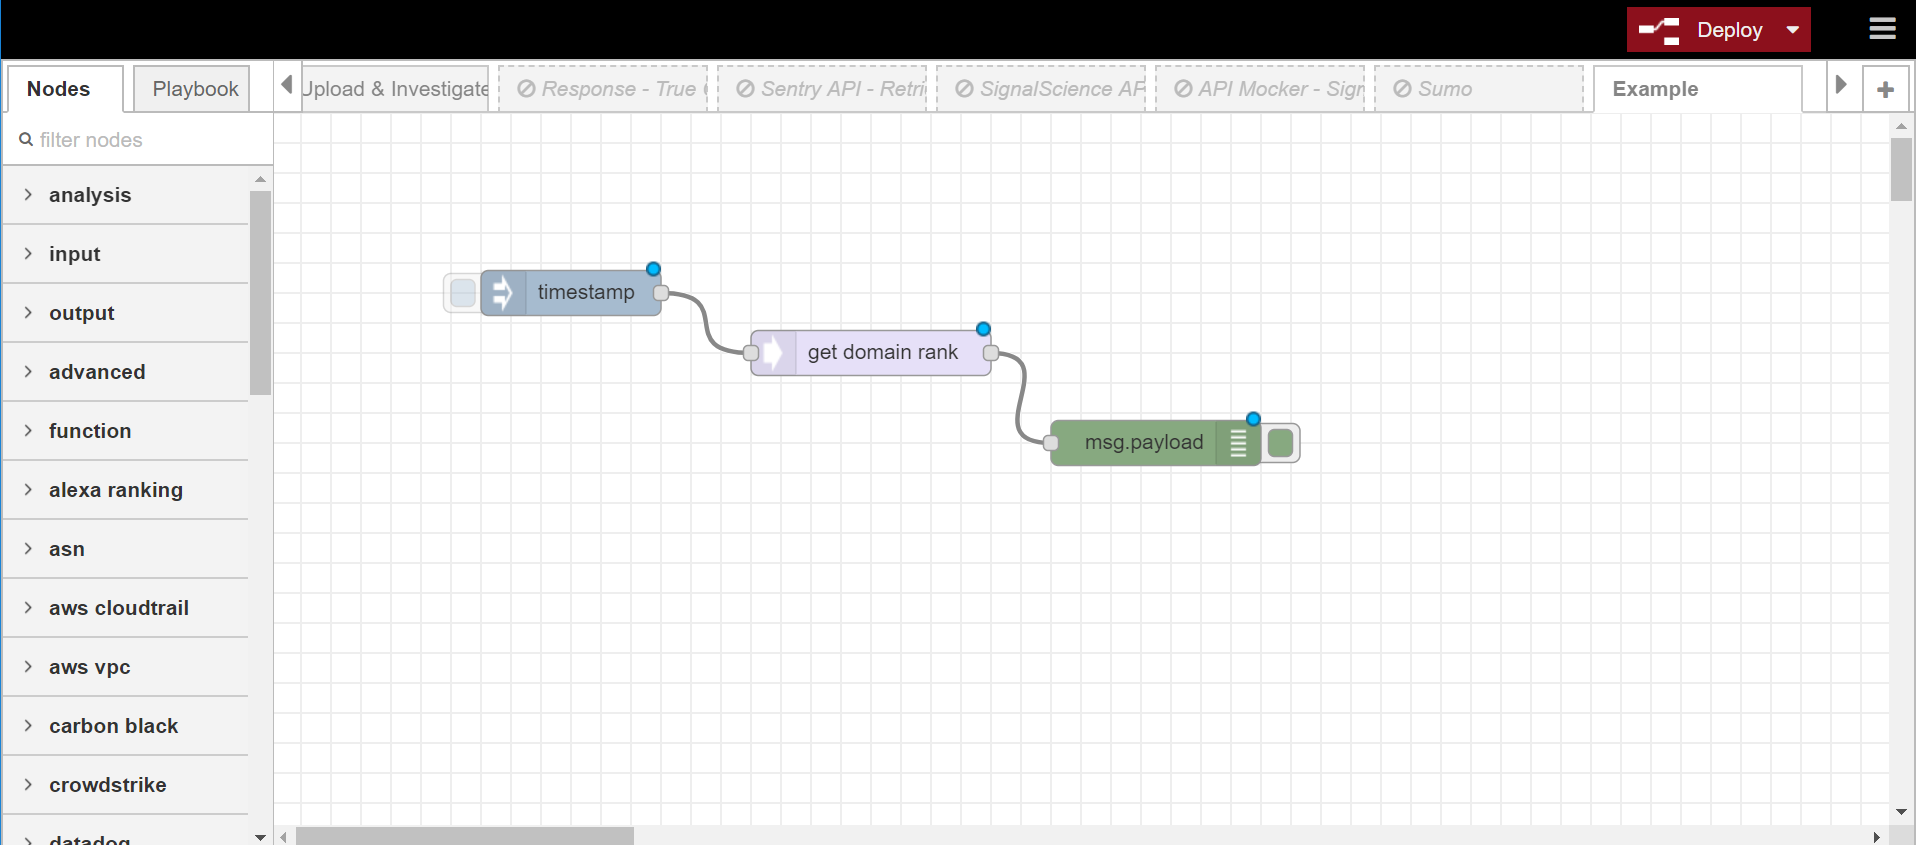
Below is an example to retrieve website popularity by alexa ranking.
- Injection
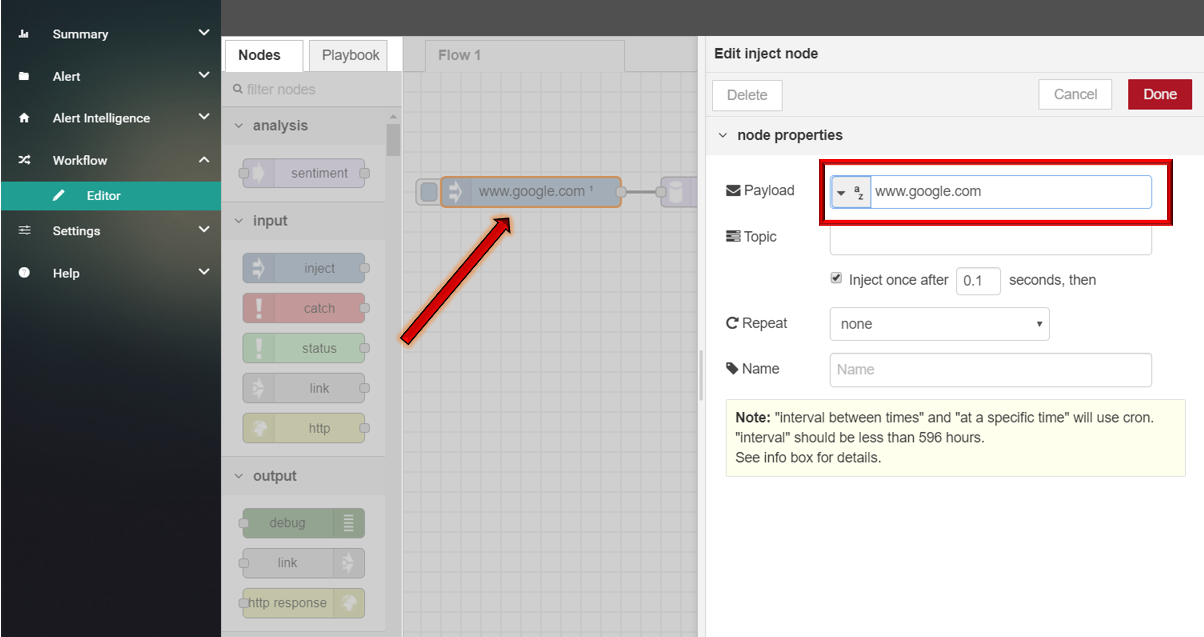
- First, we put the injection node at the beginning to trigger the start of the workflow.
- Function Node
- Then we link Alexa Ranking node right after injection.
- In the function nodes, we need to specify values.
- Take Alexa ranking as an example.
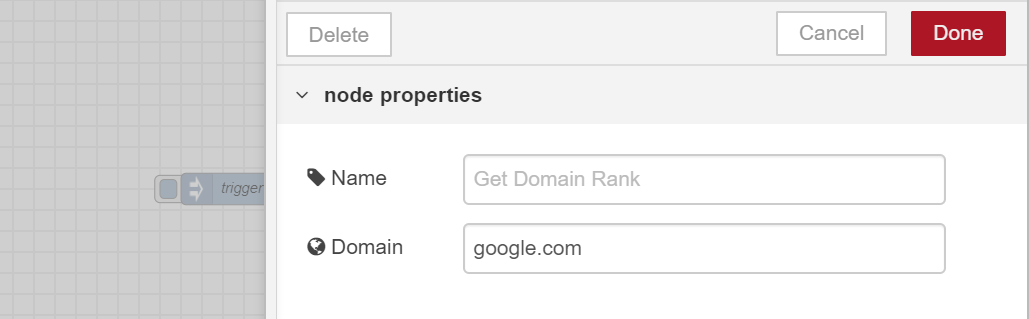
- We can use Alexa ranking to retrieve website popularity, so in the node, we need to specify which website we want to check.
- Let’s take “google.com” as an example, and specify it in the “Domain” text field.
- Output
- Finally we link the output node to receive and display the result.
- Deployment
- After the workflow is set, remember to deploy. You can deploy in three different modes: Full Workflow/Modified Nodes or Modified Flow.
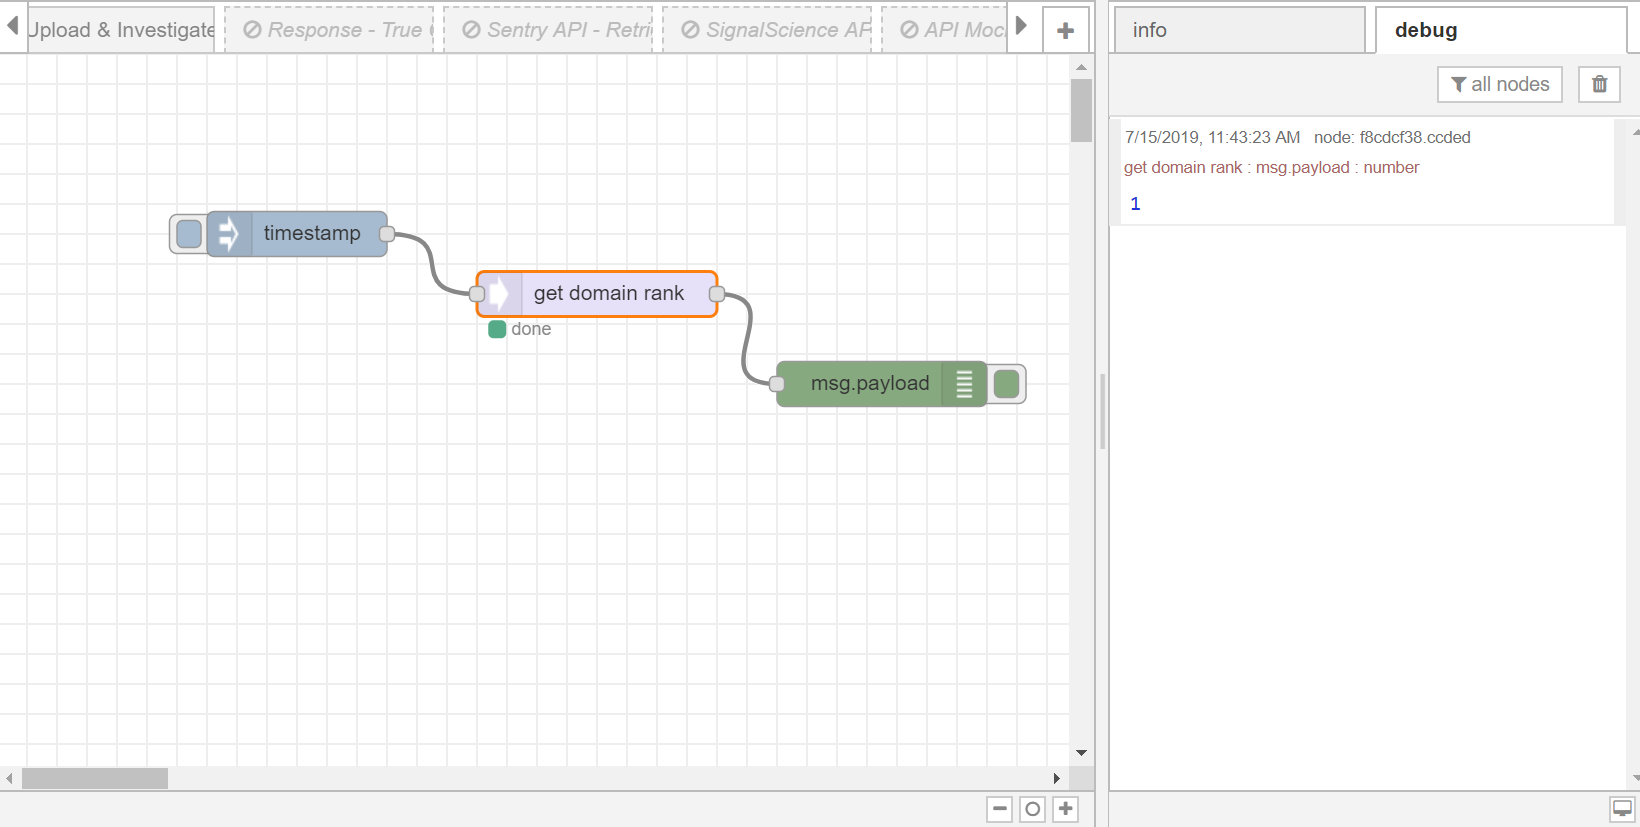
You could view the result in the debug window.
Generic Nodes
Input
We provide an input node that allows you to trigger the automation pipeline. Two main nodes we support:
- inject
Inject is good for trigger automation manually or repetitively
- http
http node allows you to create an end point which can be triggered by other functionalities.
Output
We support multi type of output. Two main output nodes are
- http response
It matches with http node to return results of http request.
- debug
It is good for debugging purpose which allows you to output results on debug panel.
Functions
We provide different functions that allow you to specify different logic
- function
- template
- delay
- trigger
- comment
- http request
- switch
- change
- range
- split
- join
- sort
- batch
- csv
- html
- json
- xml
- yaml
- python function
- group by
- wait paths
- rbe
- filter
function
A JavaScript function block to run against the messages being received by the node.
template
Sets a property based on the provided template.
delay
Delays each message passing through the node or limits the rate at which they can pass.
trigger
When triggered, can send a message, and then optionally a second message, unless extended or reset.
comment
A node you can use to add comments to your flows.
http request
Sends HTTP requests and returns the response.
switch
Route messages based on their property values or sequence position.
change
Set, change, delete or move properties of a message, flow context or global context.
The node can specify multiple rules that will be applied in the order they are defined.
range
Maps a numeric value to a different range.
split
Splits a message into a sequence of messages.
join
Joins sequences of messages into a single message.
sort
A function that sorts message property or a sequence of messages.
batch
Creates sequences of messages based on various rules.
csv
Converts between a CSV formatted string and its JavaScript object representation, in either direction.
html
Extracts elements from an html document held in msg.payload using a CSS selector.
json
Converts between a JSON string and its JavaScript object representation, in either direction.
xml
Converts between an XML string and its JavaScript object representation, in either direction.
yaml
Converts between a YAML formatted string and its JavaScript object representation, in either direction.
python function
A python function block to run against the messages being received by the node. You can write any logic in python between input and output.
group by
Aggregate data using GROUP BY function on specific key(s)
wait paths
Wait for incoming messages from different paths to generate only an output message with the declared variables under msg.paths merged.
rbe
Report by Exception node - only passes on data if the payload has changed.
filter
A node that filters messages using the given property name and regular expression.
Third Party Nodes
Analysis
Actions supported :
- sentiment
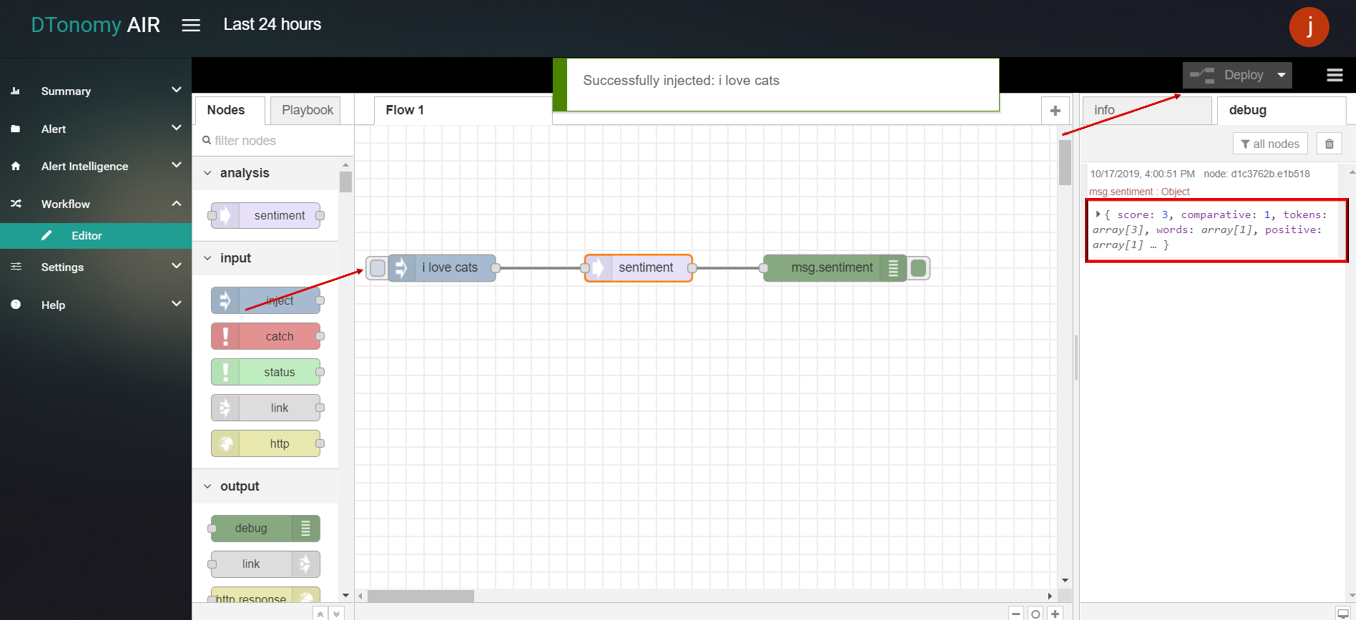
sentiment
SENTIMENT node supports users to verify sentiment inside text. Sentiment ranges from -5 to 5, represent negative to positive.
- sentiment
- Drag INJECT, SENTIMENT, DEBUG node from palette to Workspace, connect in order.
- Double click INJECT node, set Payload to String and enter text (for example: “I love cats”).
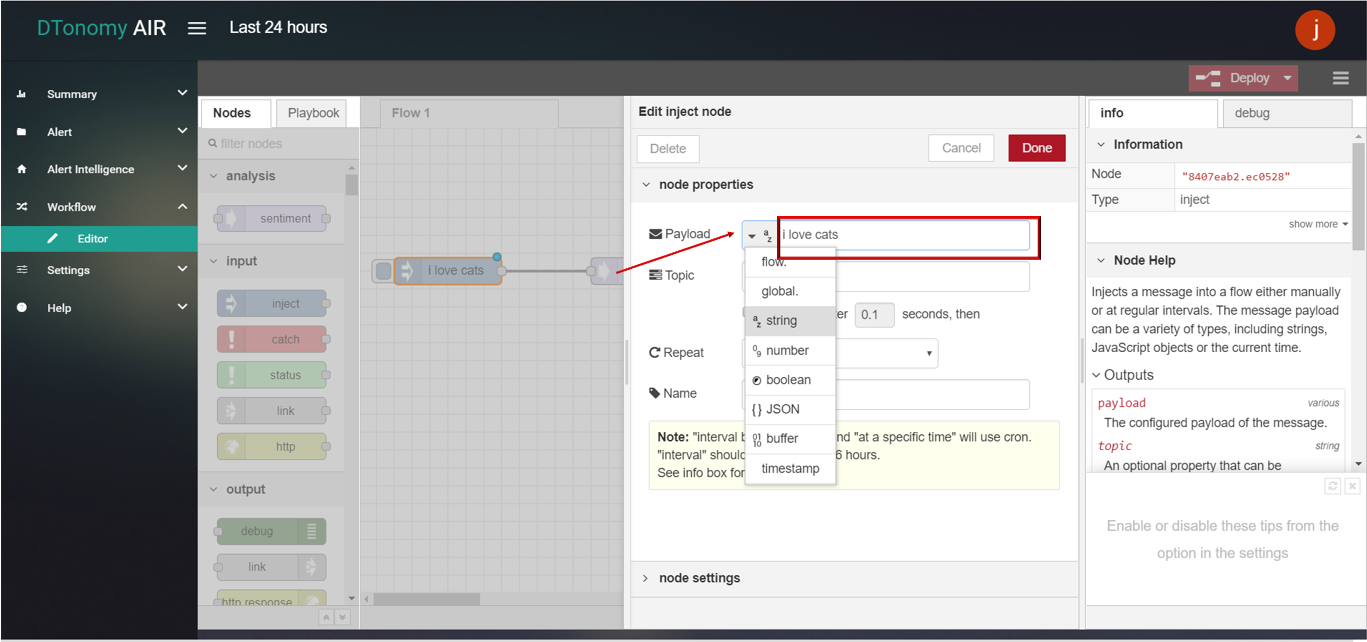
- Double click DEBUG node, set Output to “sentiment” (or sentiment.score)
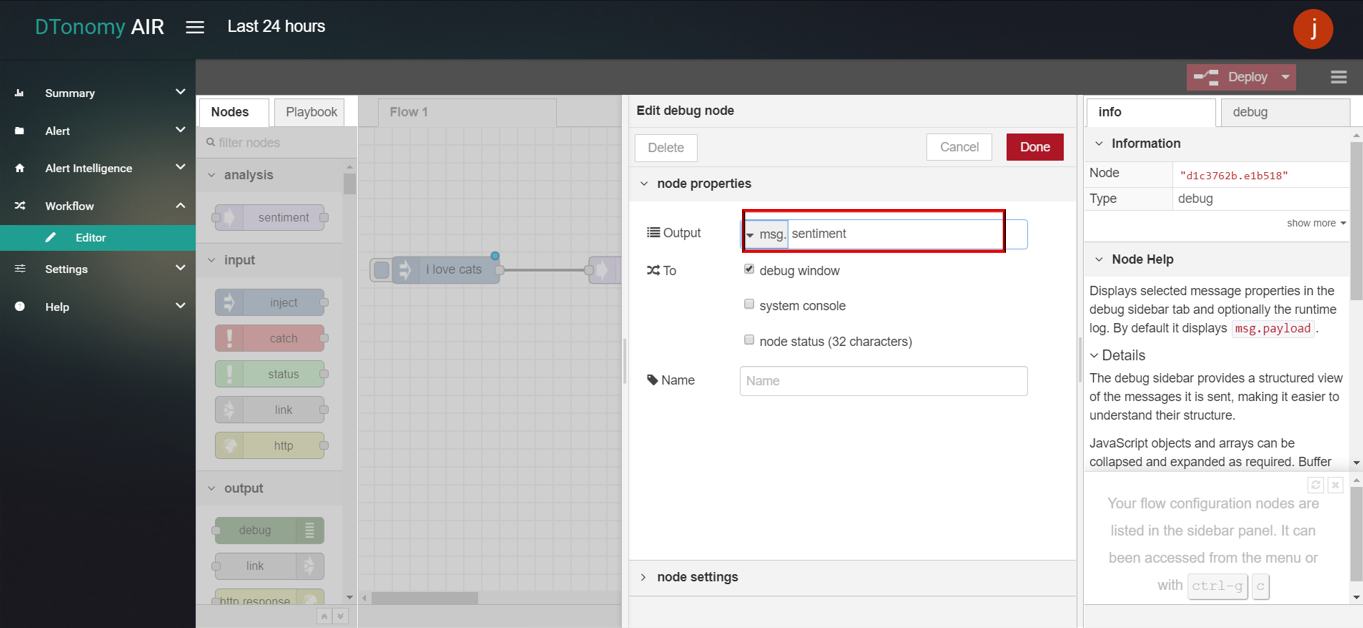
- Click the Save button, then click the INJECT button with DEBUG sidebar tab open, the result is shown in the debug window.
Alexa Ranking
Actions supported :
- get domain rank
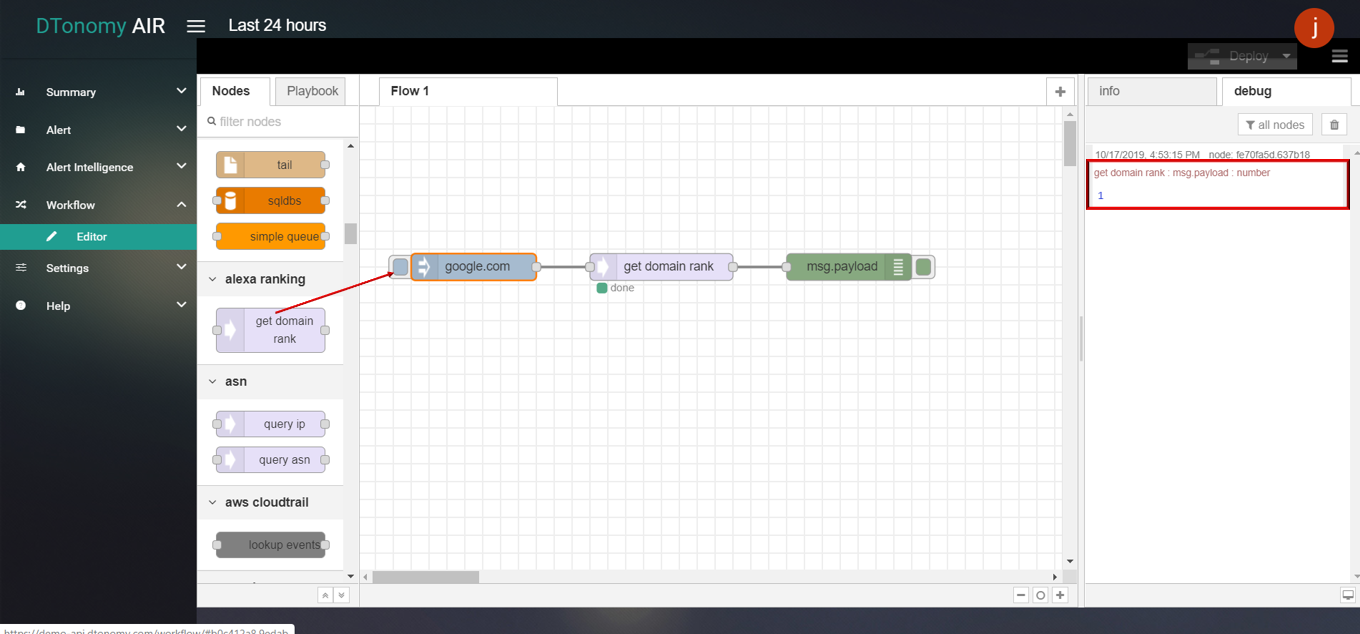
get domain rank
get domain rank node supports users to get domain level from domain name.
- get domain rank
- Drag INJECT, GET DOMAIN RANK, DEBUG node from palette to Workspace, connect in order.
- Double click INJECT node, set Payload to String and enter text (must not include “wwww.”. For example: google.com).
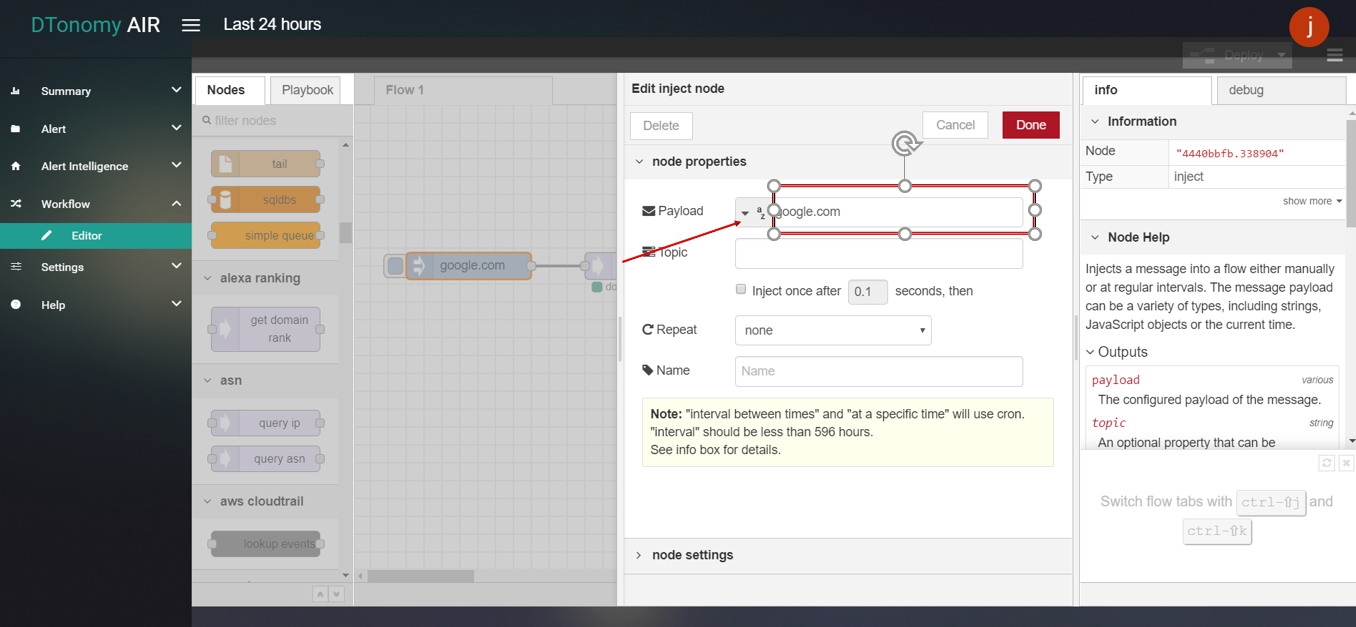
- Click the Save button, then click the INJECT button with DEBUG sidebar tab open, result is shown in the debug window.
ASN
Actions supported :
- query ip
- query asn
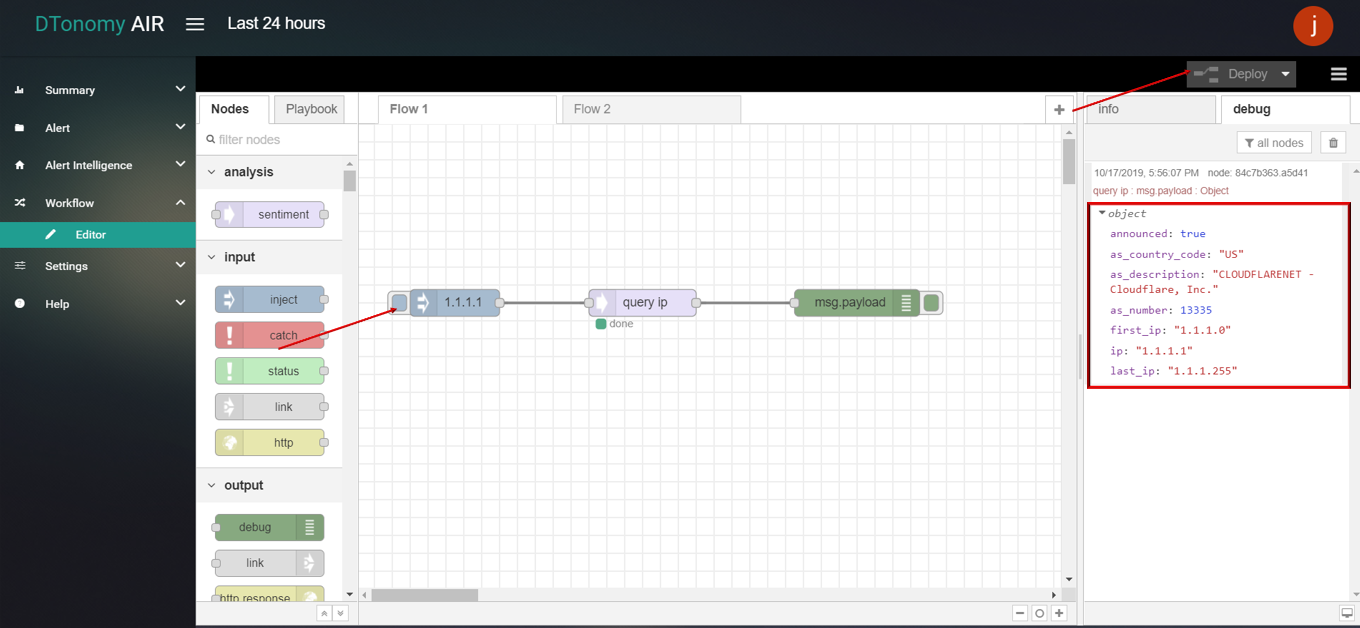
query ip
query ip node supports users using ip to get detailed ip information.
- query ip
- Drag INJECT, QUERY IP, DEBUG node from palette to Workspace, connect in order.
- Double click INJECT node, set Payload to String and enter ip (For example: 1.1.1.1).
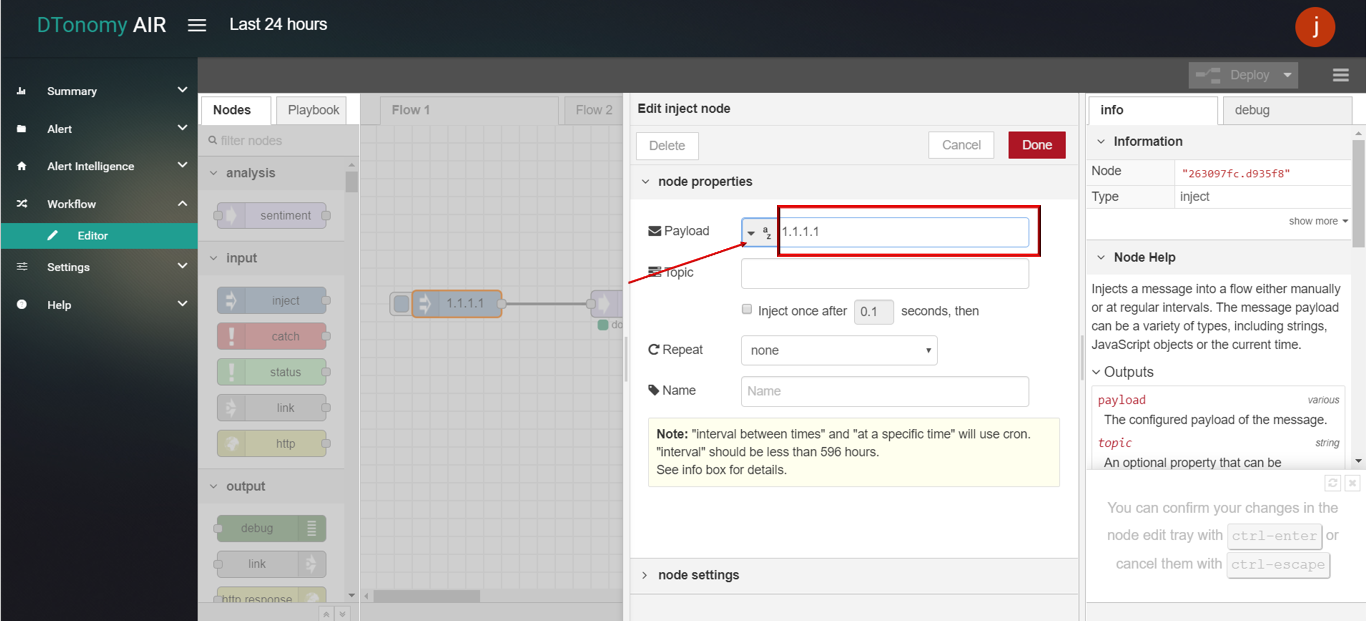
- Click the Save button, then click the INJECT button with DEBUG sidebar tab open, the result is shown in the debug window.
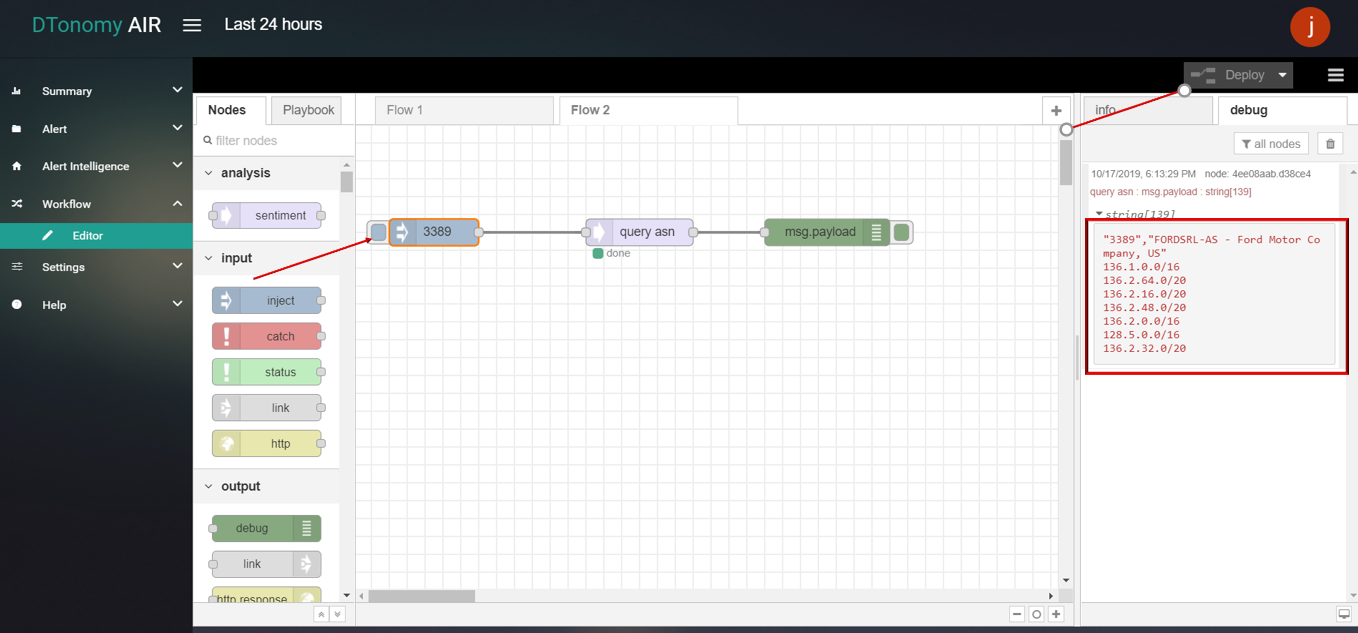
query asn
query asn node supports users using ASN(Autonomous System Number)to get detail information.
- query asn
- Drag INJECT, QUERY ASN, DEBUG node from palette to Workspace, connect in order.
- Double click the INJECT node, set Payload to String and enter ASN (for example: 3389).
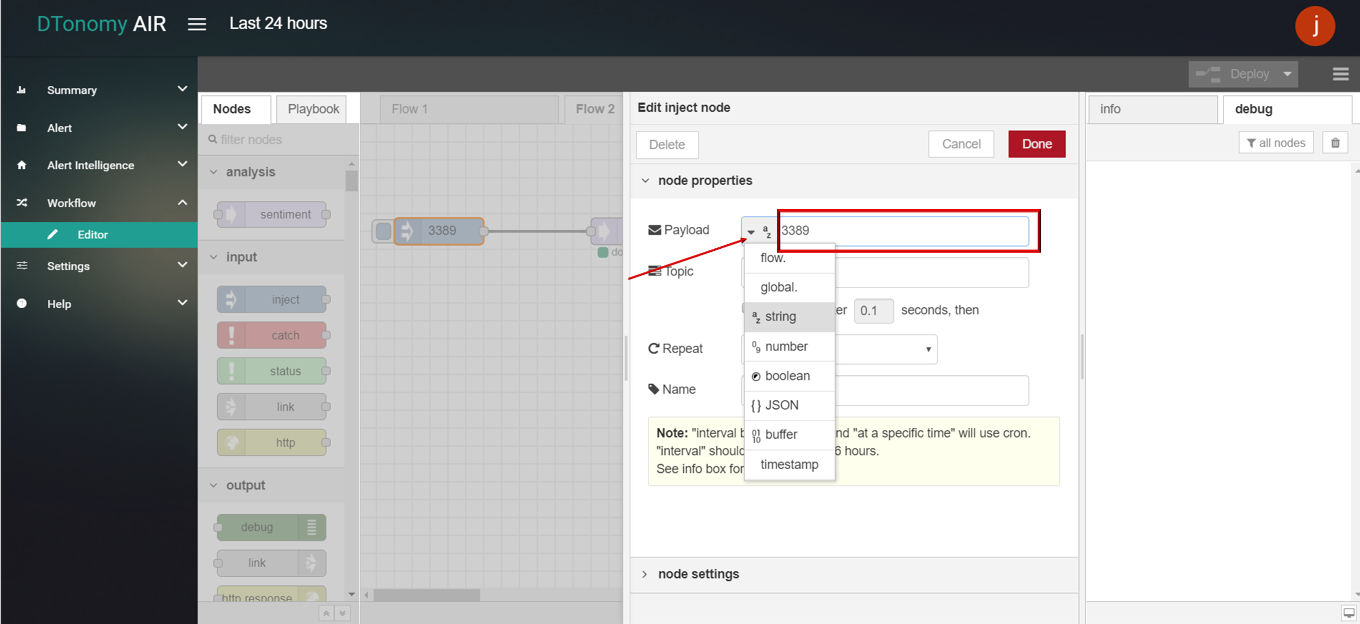
- Click the Save button, then click the INJECT button with DEBUG sidebar tab open, result is shown in the debug window.
AWS IAM
Actions supported :
- iam delete user
- iam disable user
- iam reset password
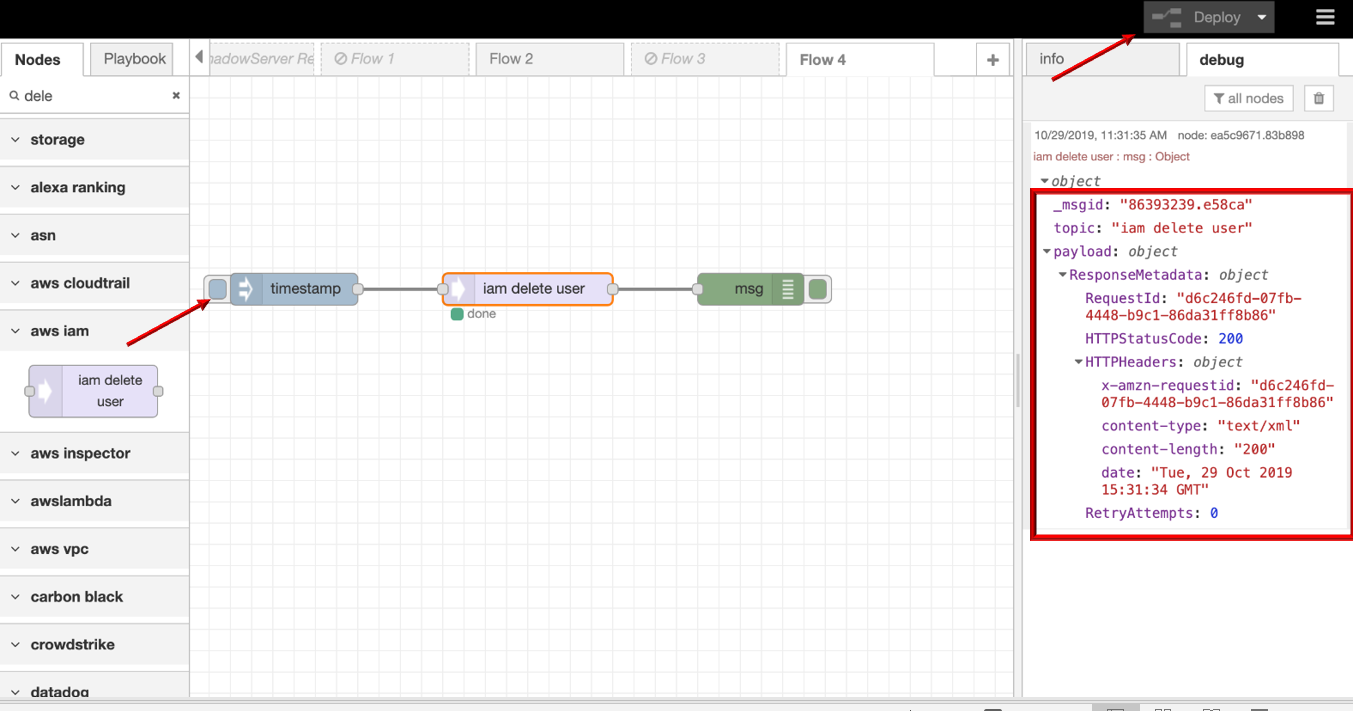
iam delete user
iam delete user node supports user to delete AWS IAM account through DTonomy API.
- iam delete user
- Drag INJECT, IAM DELETE USER, DEBUG node from palette to Workspace, connect in order.
- Double click INJECT node, enter username to delete and configure Server with AccessKeyID, SecretAccessID,RegionName based on your AWS account info.
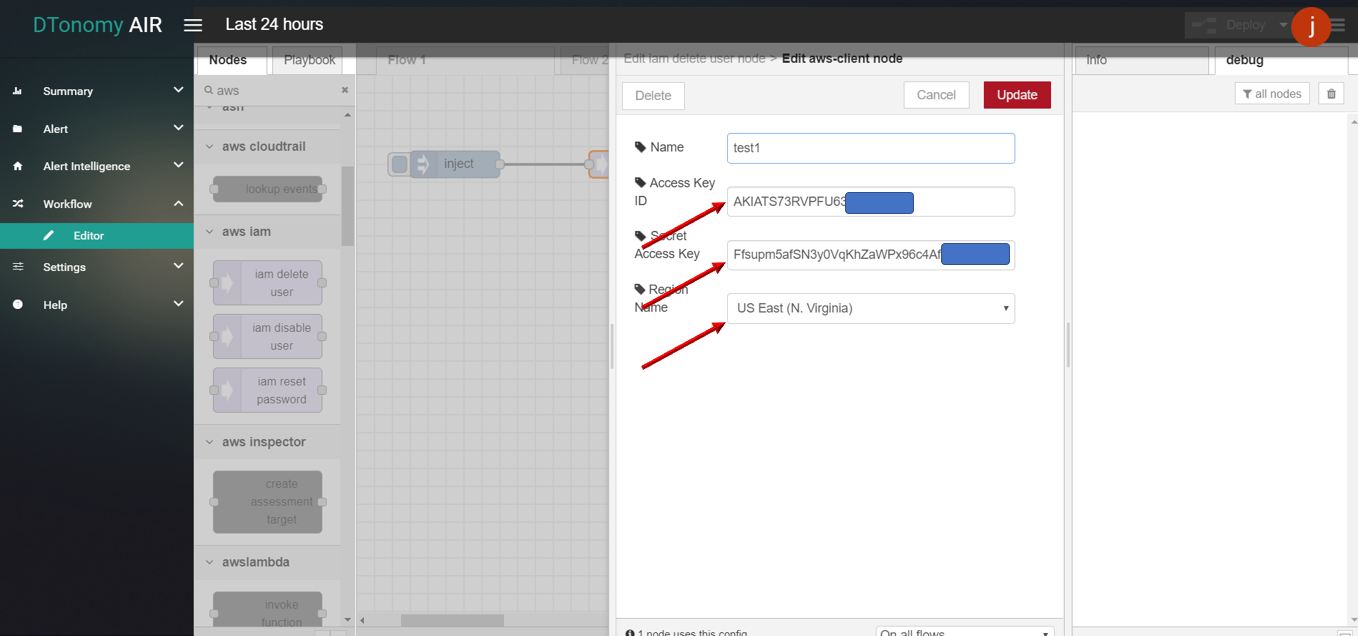
- Click the Save button, then click the INJECT button with DEBUG sidebar tab open, result is shown in the debug window if succeed.
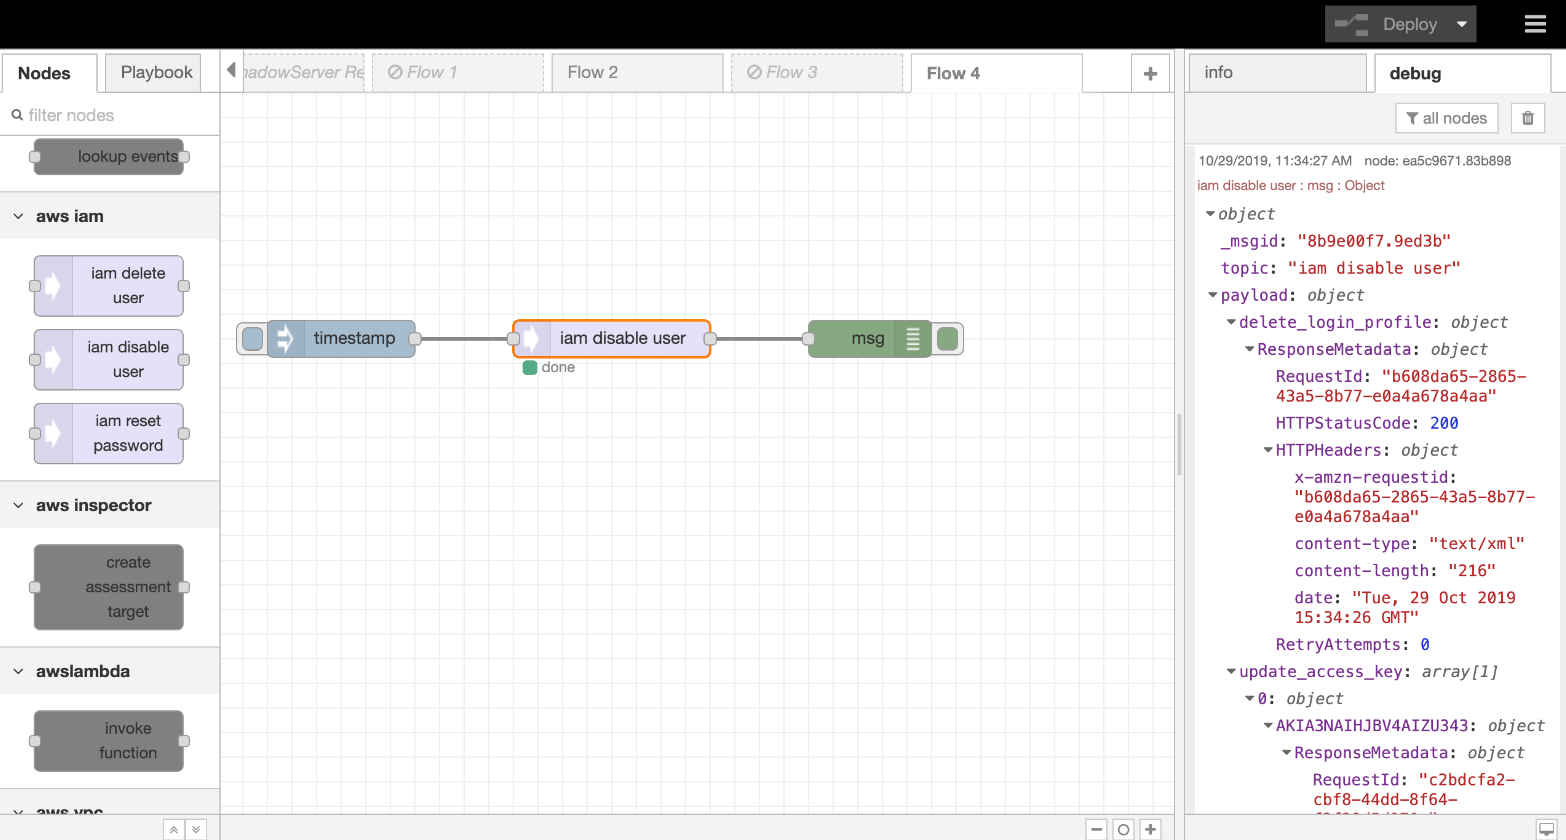
iam disable user
iam disable user allows user to disable AWS IAM account through DTonomy API.
- iam disable user
- Drag INJECT, IAM DISABLE USER, DEBUG node from palette to Workspace, connect in order.
- Double click INJECT node, enter username to disable and configure Server with AccessKeyID, SecretAccessID,RegionName based on your AWS account info.
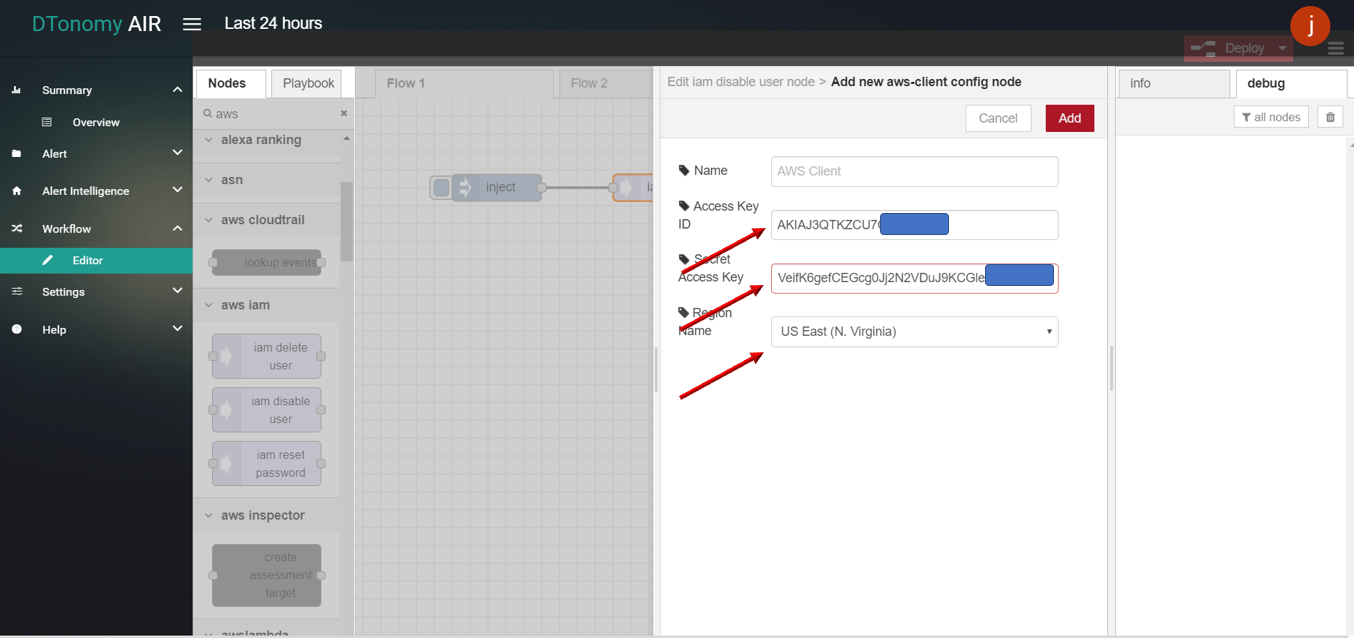
- Click the Save button, then click INJECT button with DEBUG sidebar tab open, result is shown in the debug window if succeed.
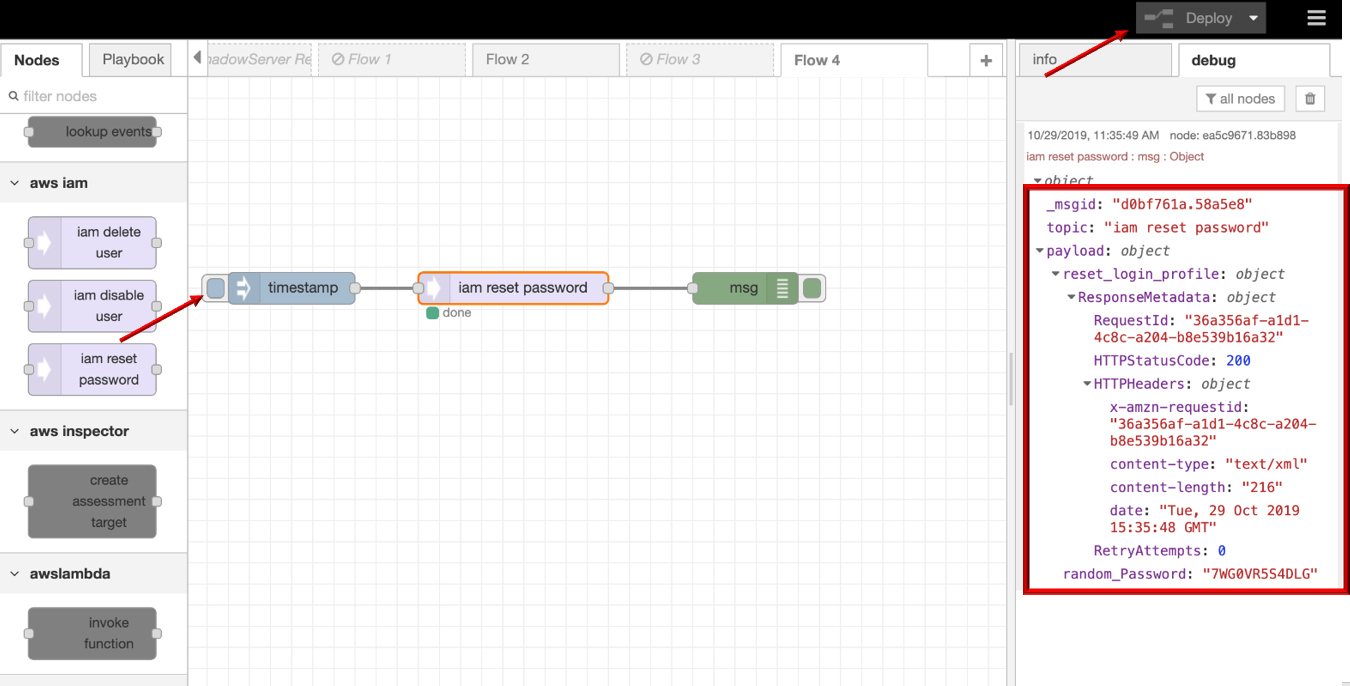
iam reset password
iam reset password allows user to reset AWS IAM account password with a random generated password through DTonomy API.
- iam reset password
- Drag INJECT, IAM RESET PASSWORD, DEBUG node from palette to Workspace, connect in order.
- Double click INJECT node, enter username to reset and configure Server with AccessKeyID, SecretAccessID,RegionName based on your AWS account info.
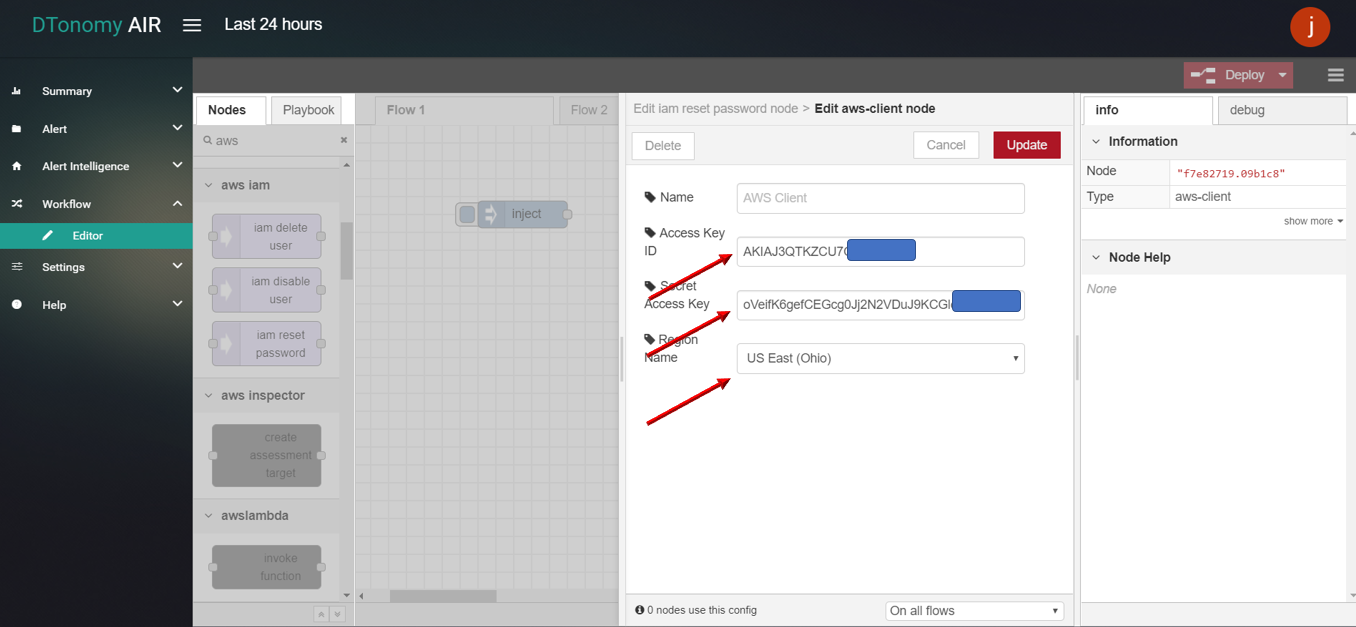
- Click Save button, then click INJECT button with DEBUG sidebar tab open, result with random generated password is shown in the debug window if successed.
AWS
We support connectors to different AWS data sources and actions :
- aws cloudtrail – lookup events
- aws vpc – create security group
- aws vpc – block ip
- aws inspector – create assessment targets
- aws lambda – invoke function
- aws waf – waf get ip
You need access keys to be able to use AWS connectors:
- 1. Log in/Sign up your AWS account
- Simply log into your AWS management console https://console.aws.amazon.com/console/
- 2. Create Access Key ID and Secret Access Key
- In your AWS Management Console, go to Identity and Access Management (IAM)
- Refer to AWS docs to get your access Keys: https://docs.aws.amazon.com/general/latest/gr/aws-sec-cred-types.html
- Download your access keys for later use
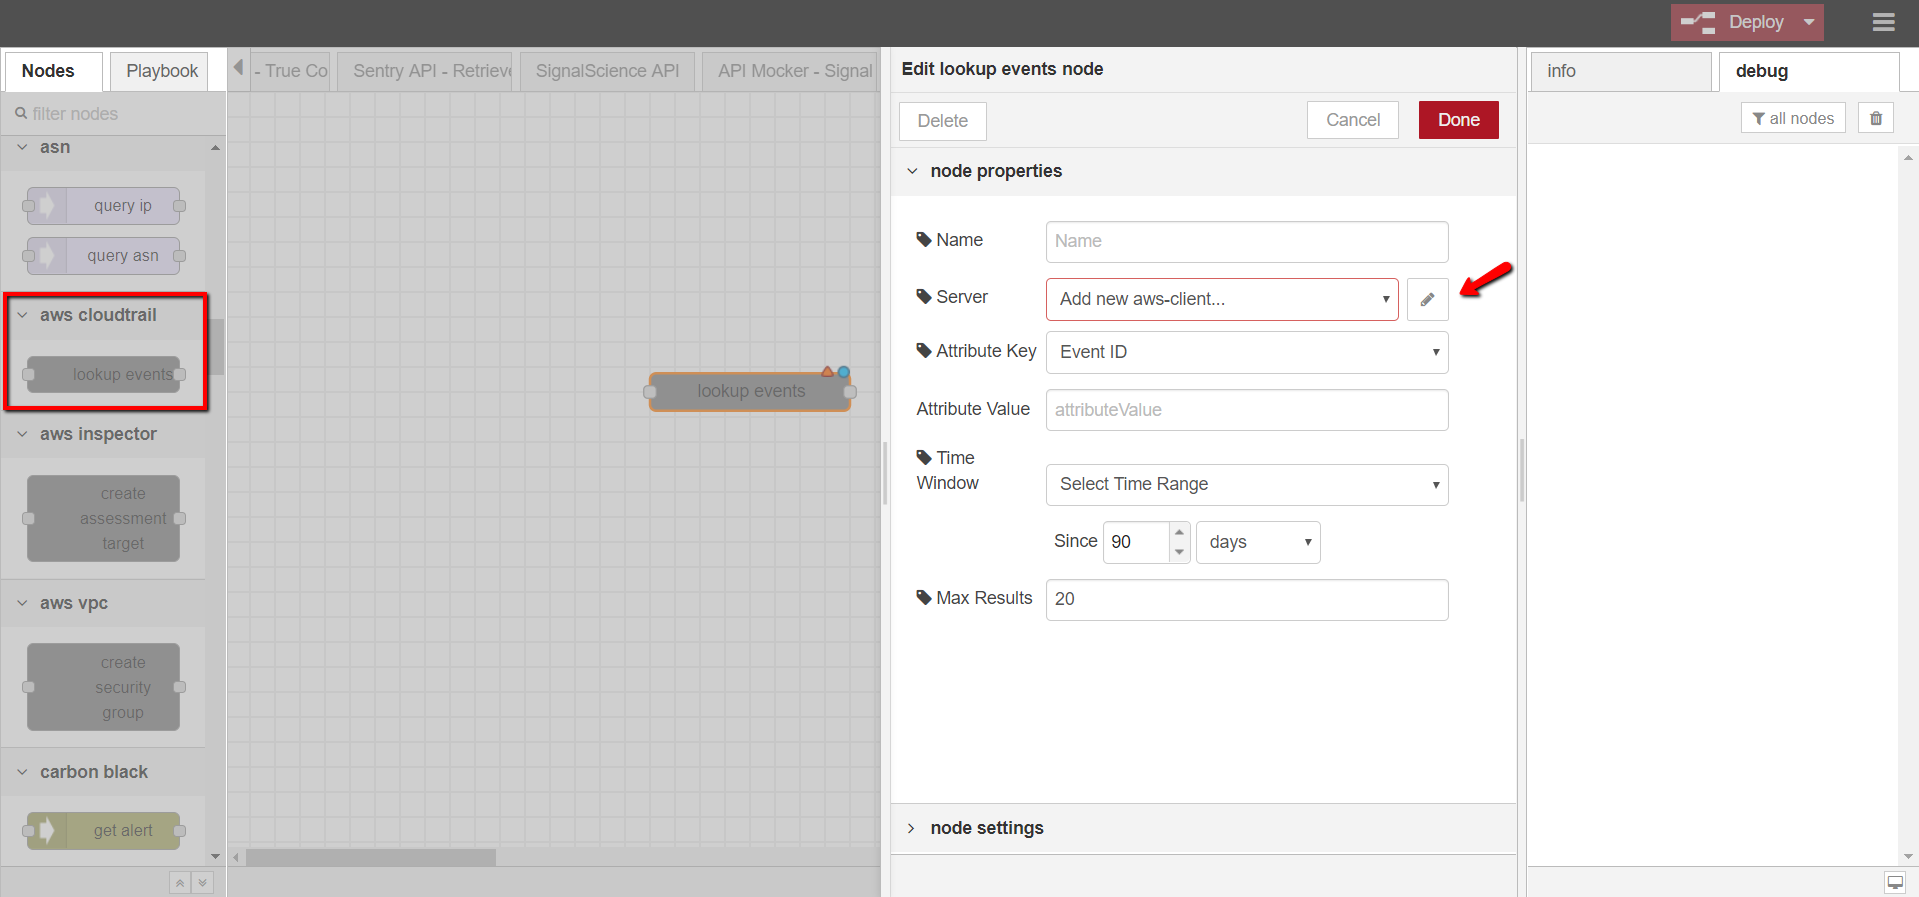
aws cloudtrail – lookup events
Looks up management events captured by CloudTrail by various attribute keys
- aws cloudtrail – lookup events
- Open DTonomy Workflow, drag and drop AWS CloudTrail -> LOOKUP EVENTS node to the workspace
- Double-click on the node to configure it
- Provide node name (optional), server info (use the access keys from step 2), attribute key and value, time window and max results
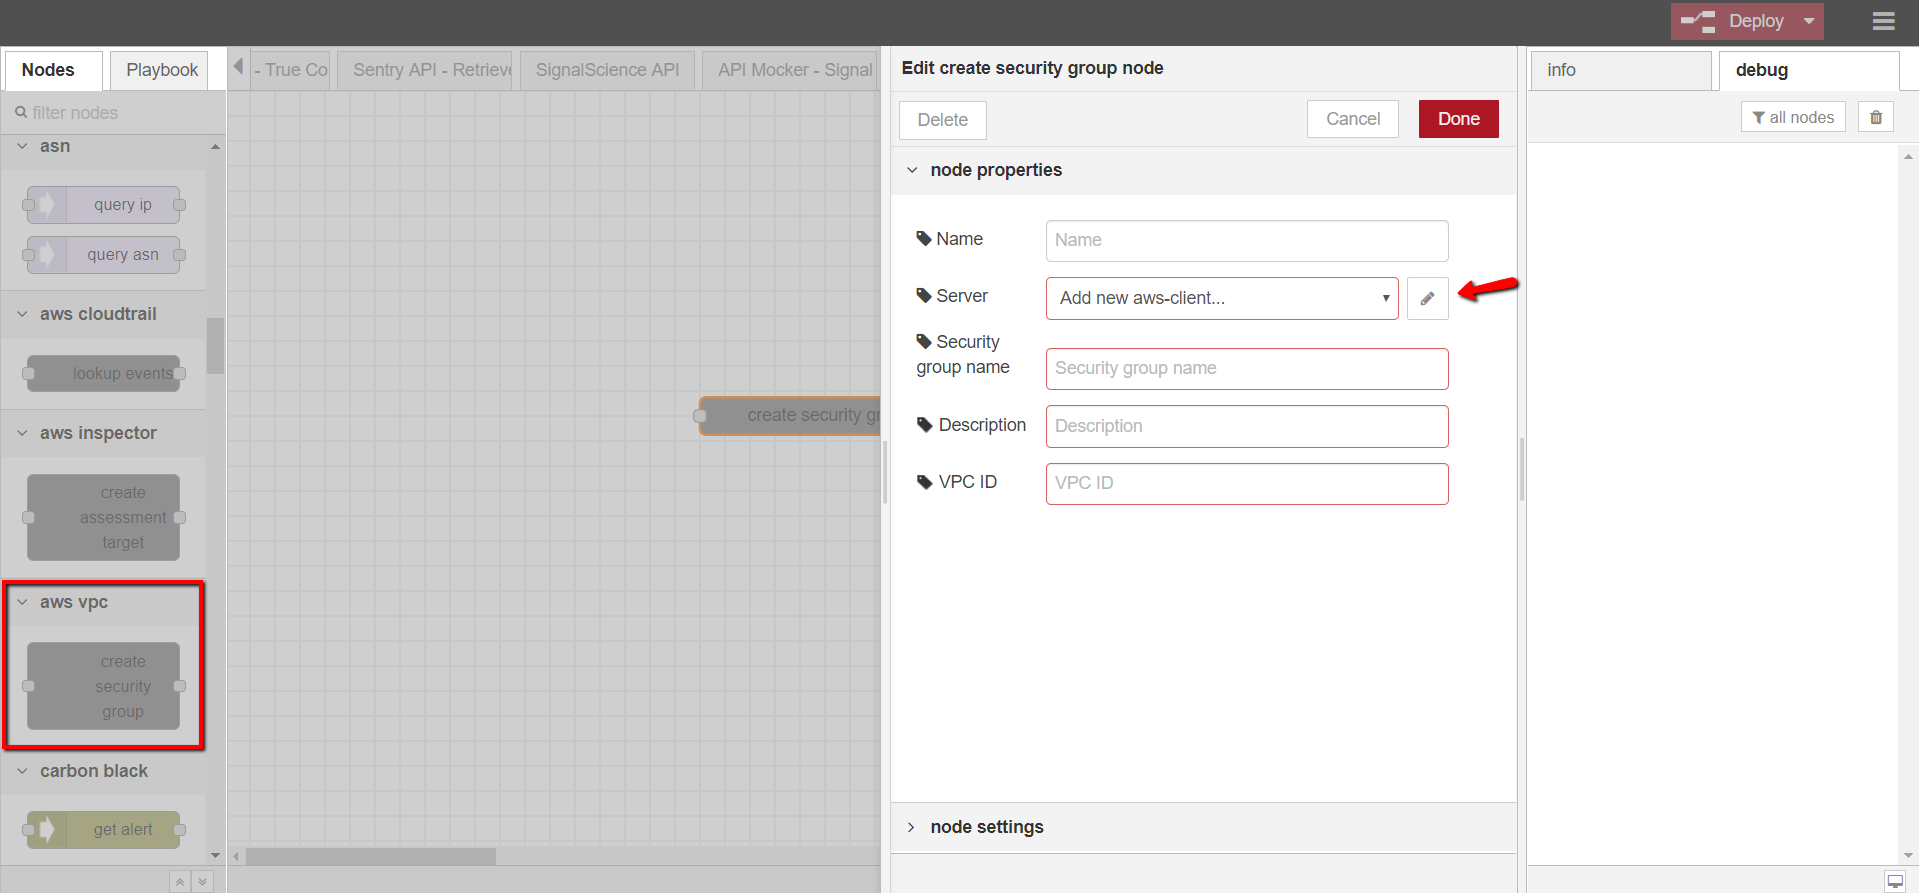
aws vpc – create security group
retrieve AWS VPC logs
- aws vpc – create security group
- Open DTonomy Workflow, drag and drop AWS VPC -> CREATE SECURITY GROUP node to the workspace
- Double-click on the node to configure it
- Provide node name (optional), server info (use the access keys from step 2), security group name, description, and VPC ID (you can get VPC ID from your AWS management console)
aws vpc – block ip
Block an IP address using AWS VPC Network ACL
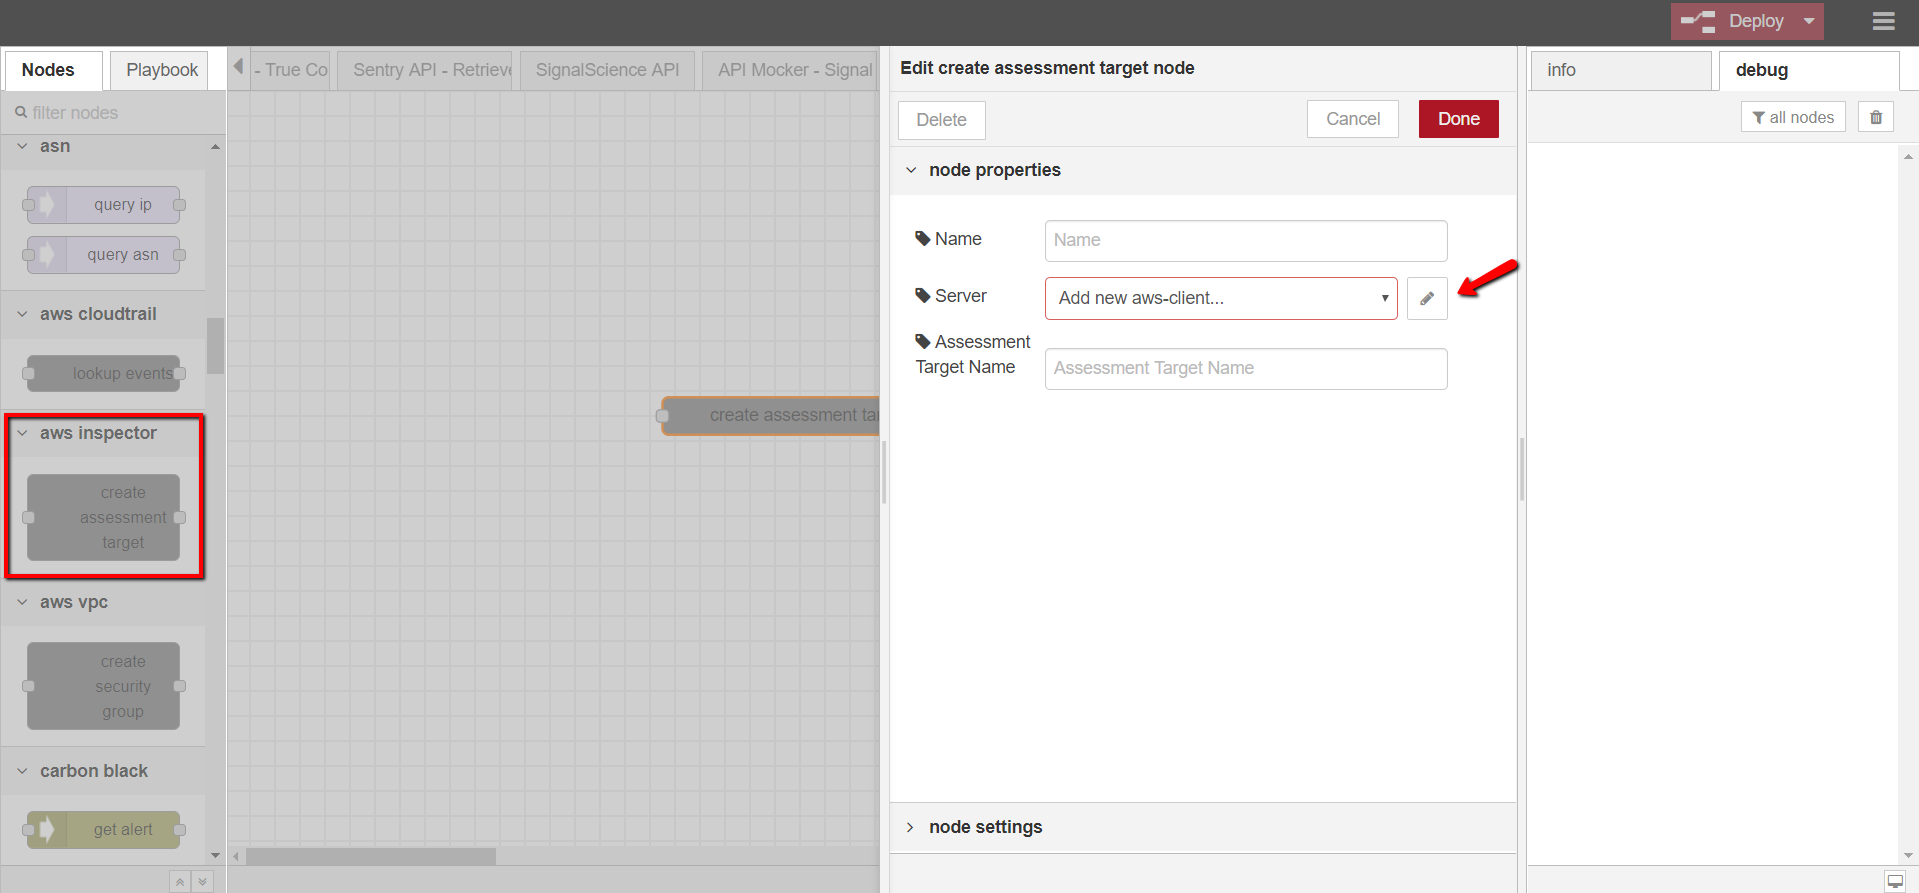
aws inspector – create assessment targets
Creates a new assessment target using the ARN of the resource group
- aws inspector – create assessment targets
- Open DTonomy Workflow, drag and drop AWS INSPECTOR -> CREATE ASSESSMENT TARGET node to the workspace
- Double-click on the node to configure it
- Provide node name (optional), server info (use the access keys from step 2), and assess target name
aws lambda – invoke function
Invoke an AWS Lambda function
aws waf – waf get ip
Get all IP addresses in AWS WAF.
- Test the AWS nodes
- Drag and drop INJECT node and DEBUG node to the workspace with the first connecting to the input of your node and the latter connecting to the output of your node
- Click Save to see the result
Carbon Black
Actions supported :
- get alert
get alert
Get a scan result from Carbon Black based on alert id.
Crowd Strike
Actions supported :
- CrowdStrikeIn
- persistFeature
- featureExtraction
- update Training
- find detections
- find detections details
CrowdStrikeIn
Read an array of crowdstrike data.
persistFeature
Persist Feature.
featureExtraction
Extract Feature.
update Training
Update Training Data.
find detections
Find detections in CrowdStrike.
find detections details
Find details of a detection by id in CrowdStrike.
Datadog
Actions supported :
- get an event
Datadog node allows the user to retrieve an event from the Datadog platform.
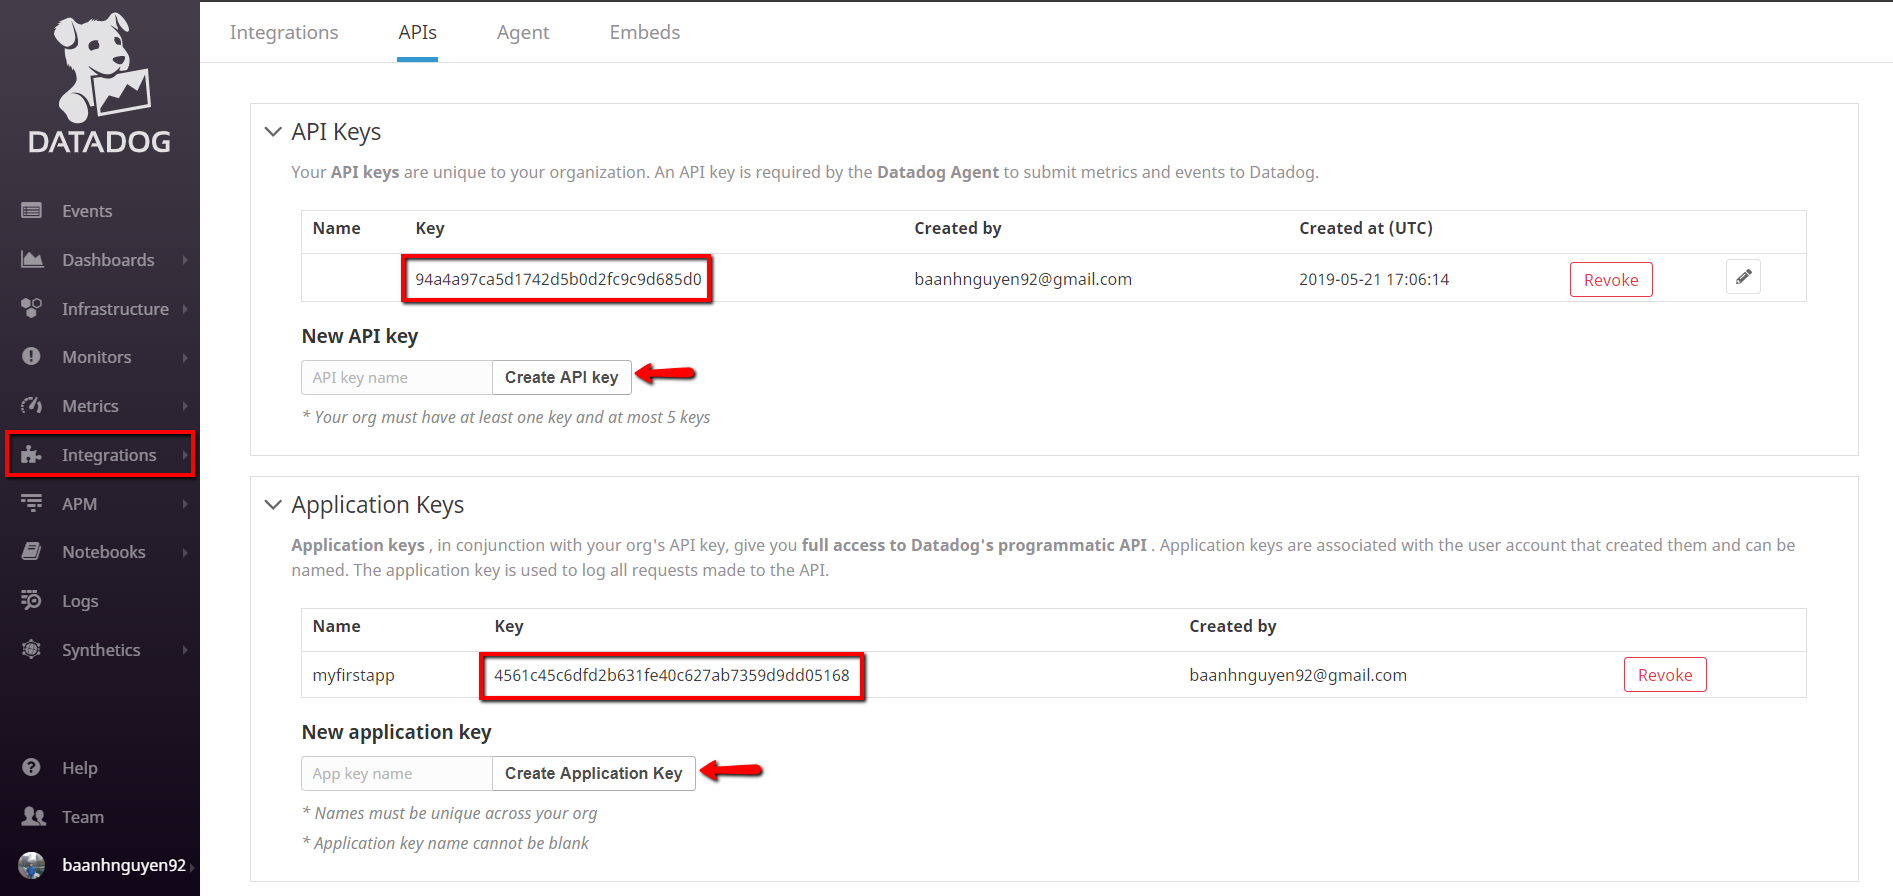
- 1. Log in/Sign up your Datadog account
- Simply log into your created account https://app.datadoghq.com/dashboard/lists
- 2. Create API Keys and Application Keys
On the left menu, go to Integrations -> APIs to create these two keys
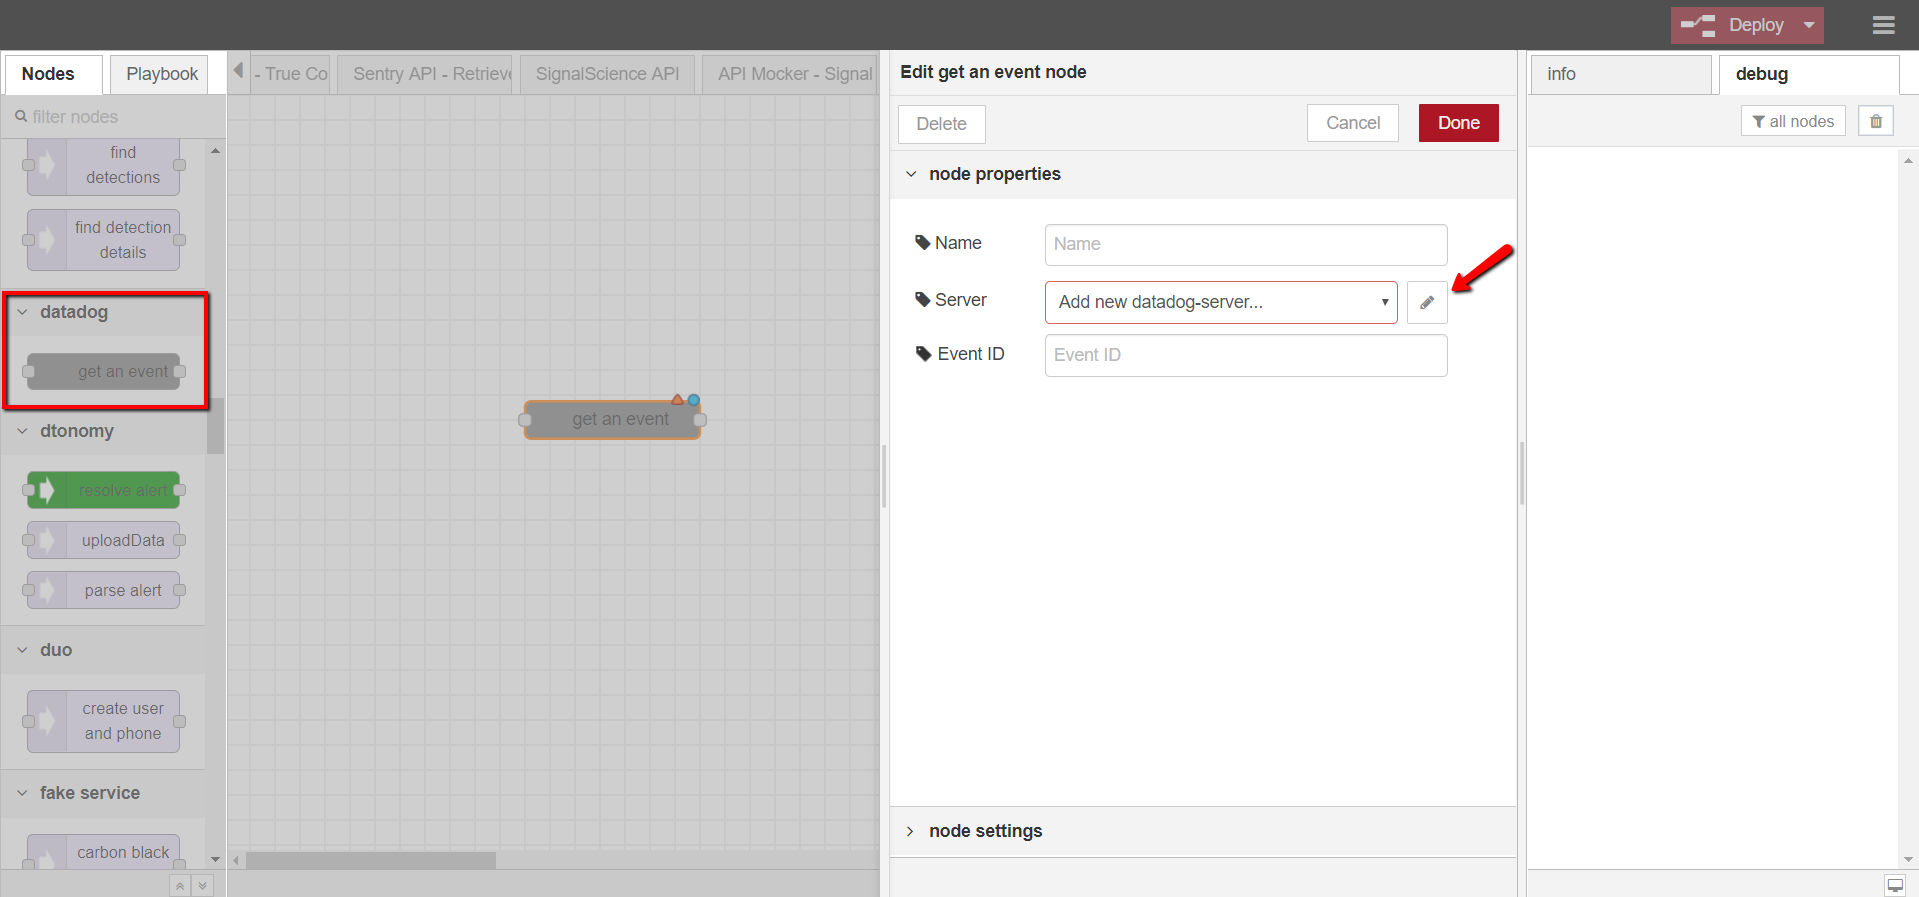
- 3. Configure the Datadog node
- Open DTonomy Workflow, drag and drop Datadog -> GET AN EVENT node to the workspace
- Double-click on the node to configure it
- Provide node name (optional), server info (use the API Keys and Application Keys from step 2), and event ID (optional)
- 4. Test the Datadog node
- Drag and drop INJECT node and DEBUG node to the workspace with the first connecting to the input of GET AN EVENT node and the latter connecting to the output of GET AN EVENT node
- Provide event ID in the message payload of the INJECT node and then click Save to see the result
DTonomy
Actions supported :
- resolve alert
- uploadData
- upload data advanced
- parse alert
resolve alert
Resolve Incident On DTonomy Platform.
uploadData
(Deprecated)Upload data to DTonomy Server.
upload data advanced
Upload data to DTonomy Server.
create task
Create task automatically
parse alert
Accept alert, parse them, put in global context for future investigation.
Duo
Actions supported :
- create user and phone
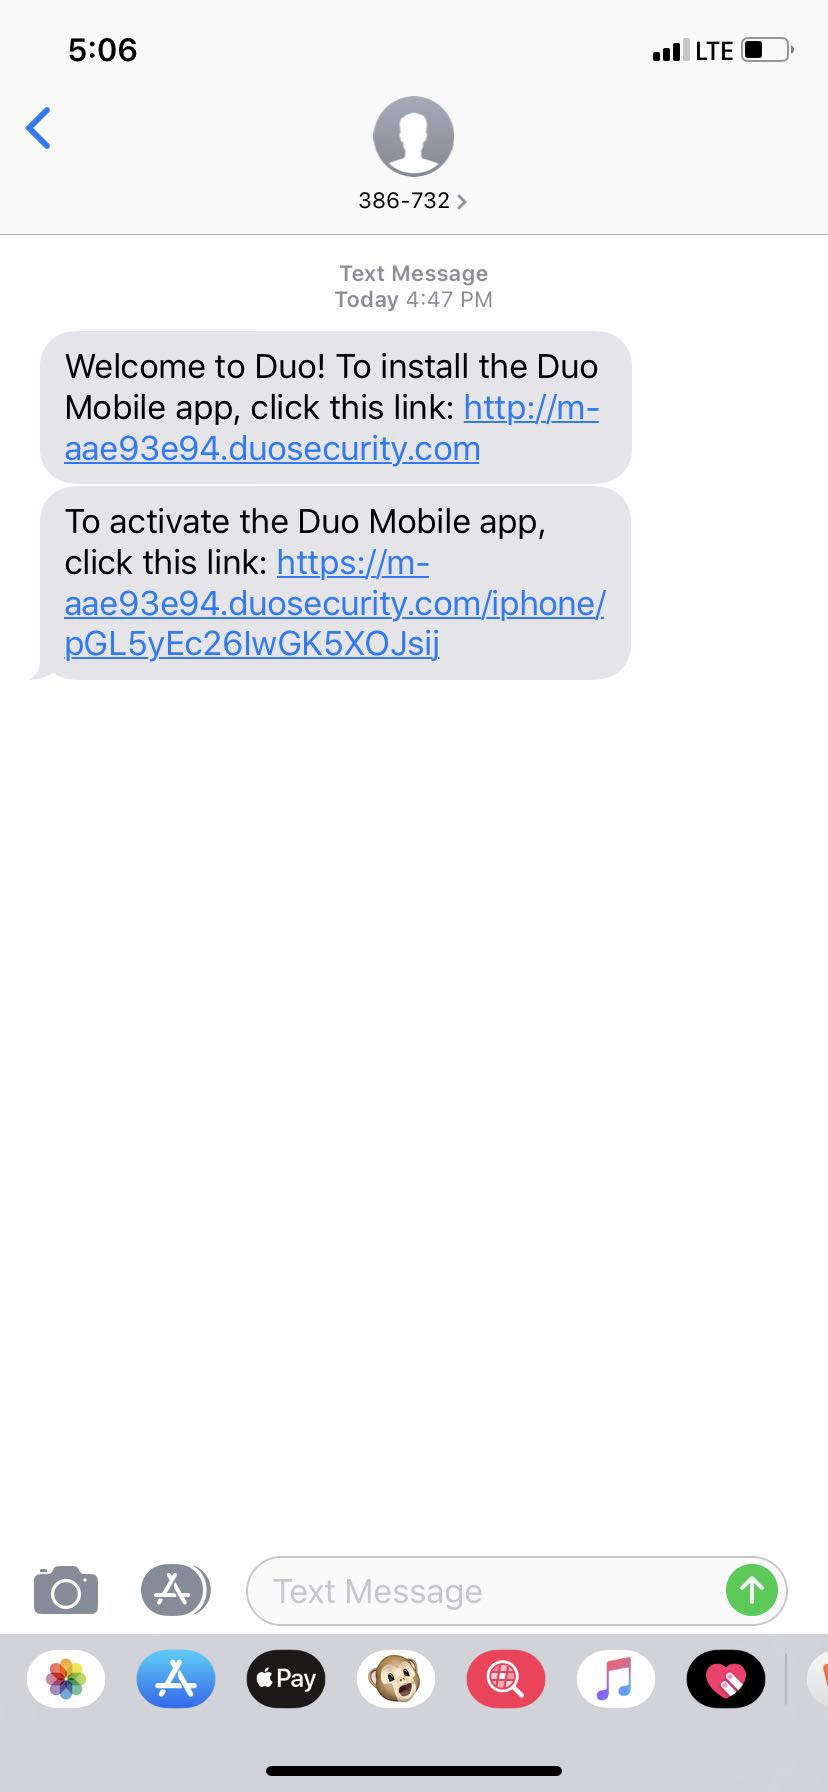
The Duo Admin Node lets users integrate with Duo Security’s platform by adding a layer of Duo authentication via SMS. (Ref: https://duo.com/docs/adminapi)
- 1. Log in/ Sign up your Duo Account
- Simply log into your desired Duo account https://admin.duosecurity.com/login?next=%2F.
- 2. Grant account access to Admin API
- To use Admin API, you have to contact Duo support https://duo.com/support.
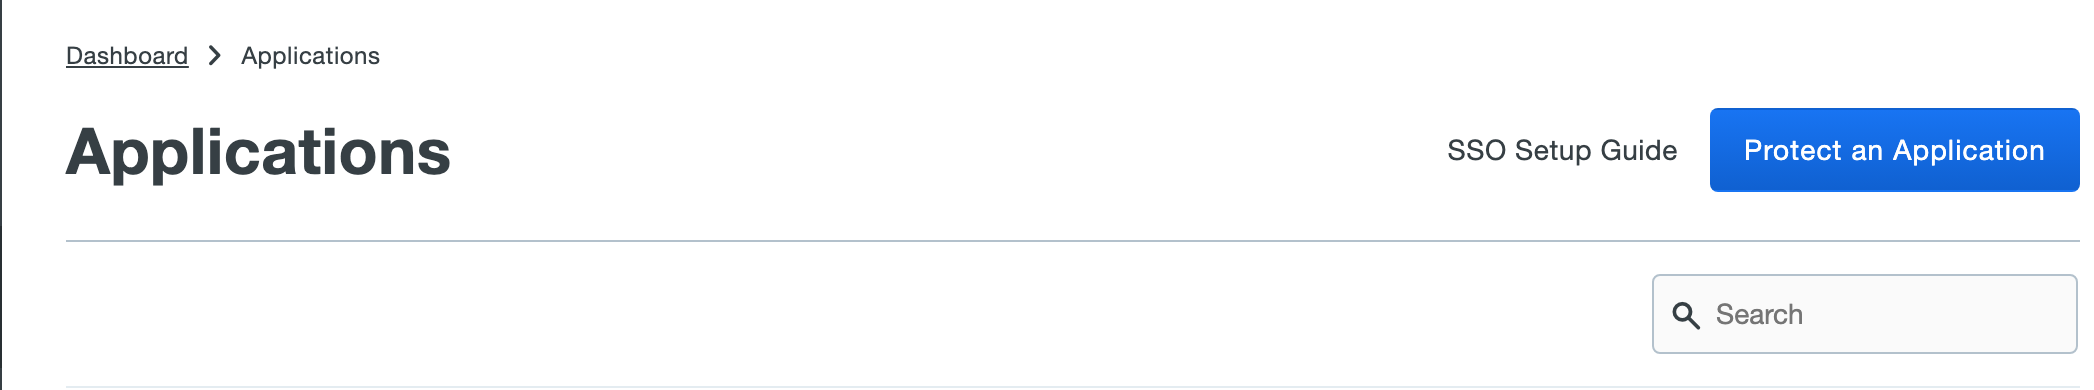
- 3. Create a new application
3.1 Go to Duo dashboard -Applications, and click “Protect an Application”:
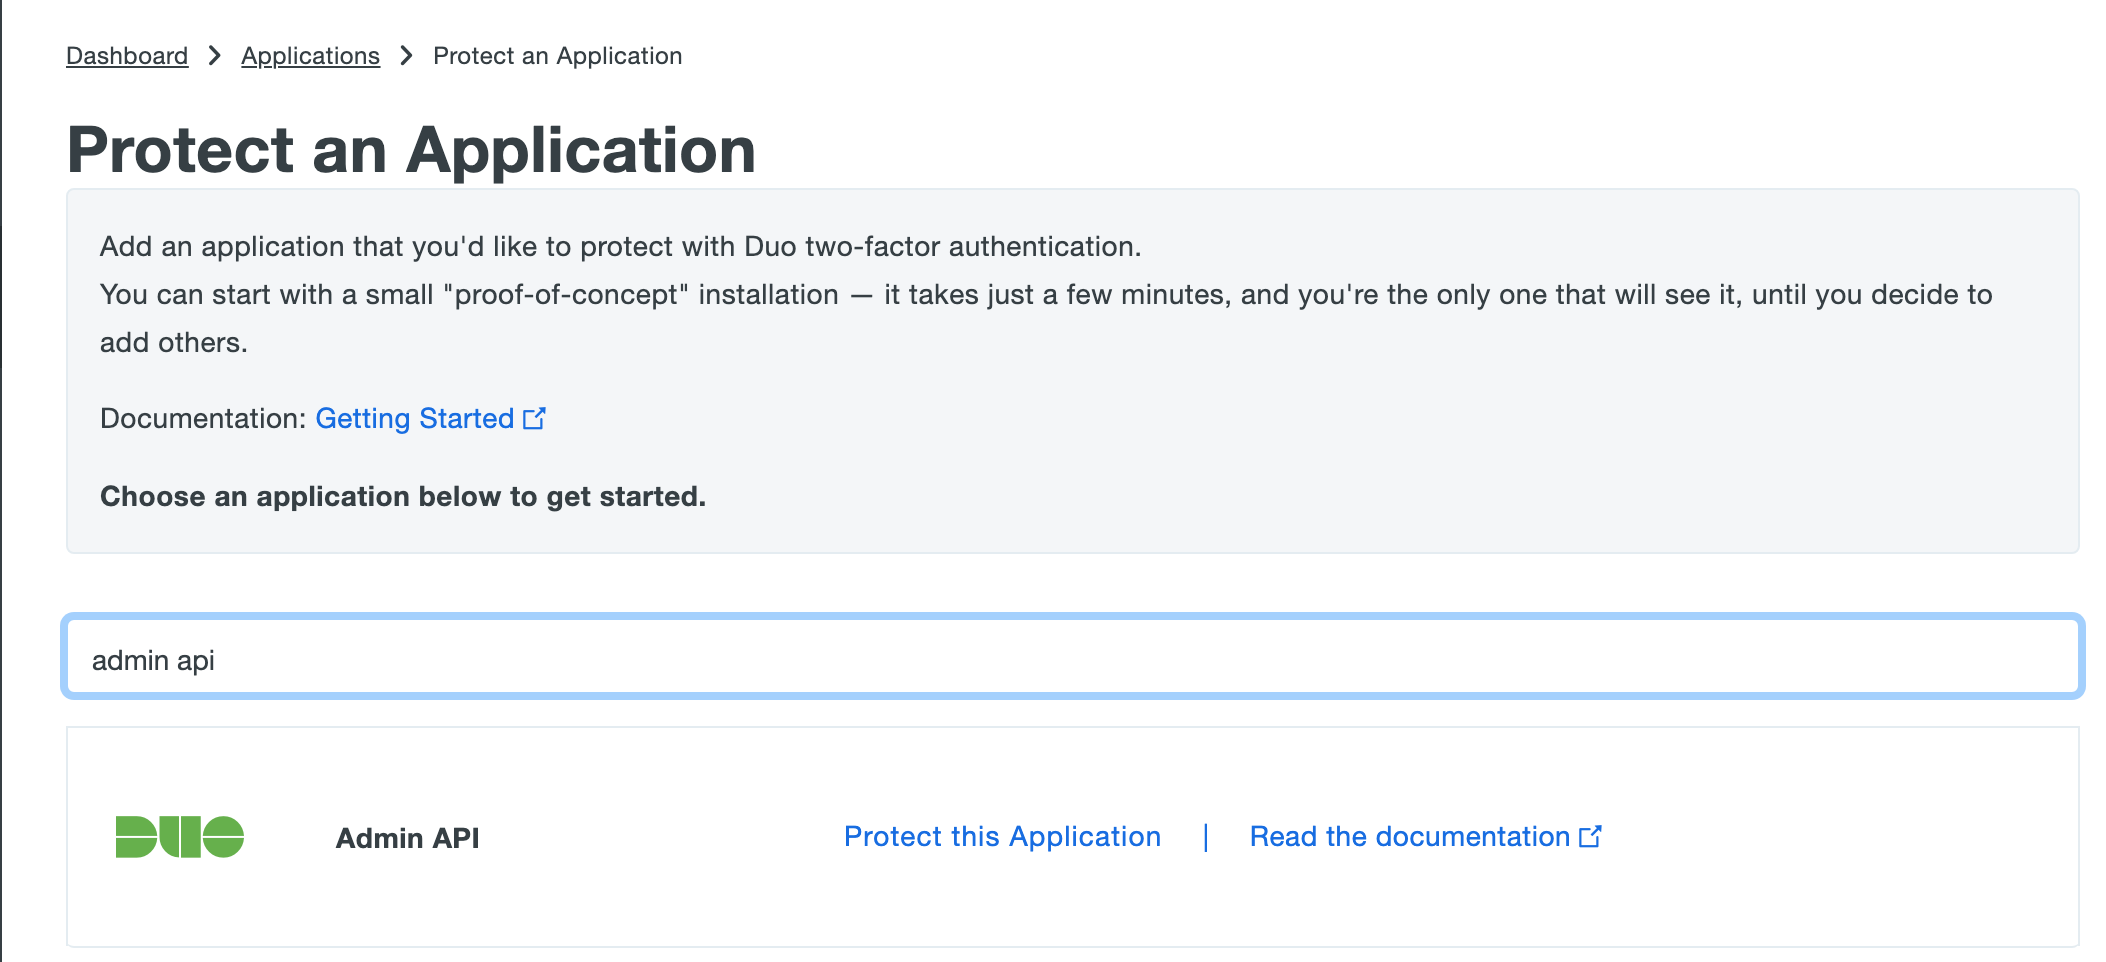
3.2 Search for “Admin API” and click “Protect this Application”
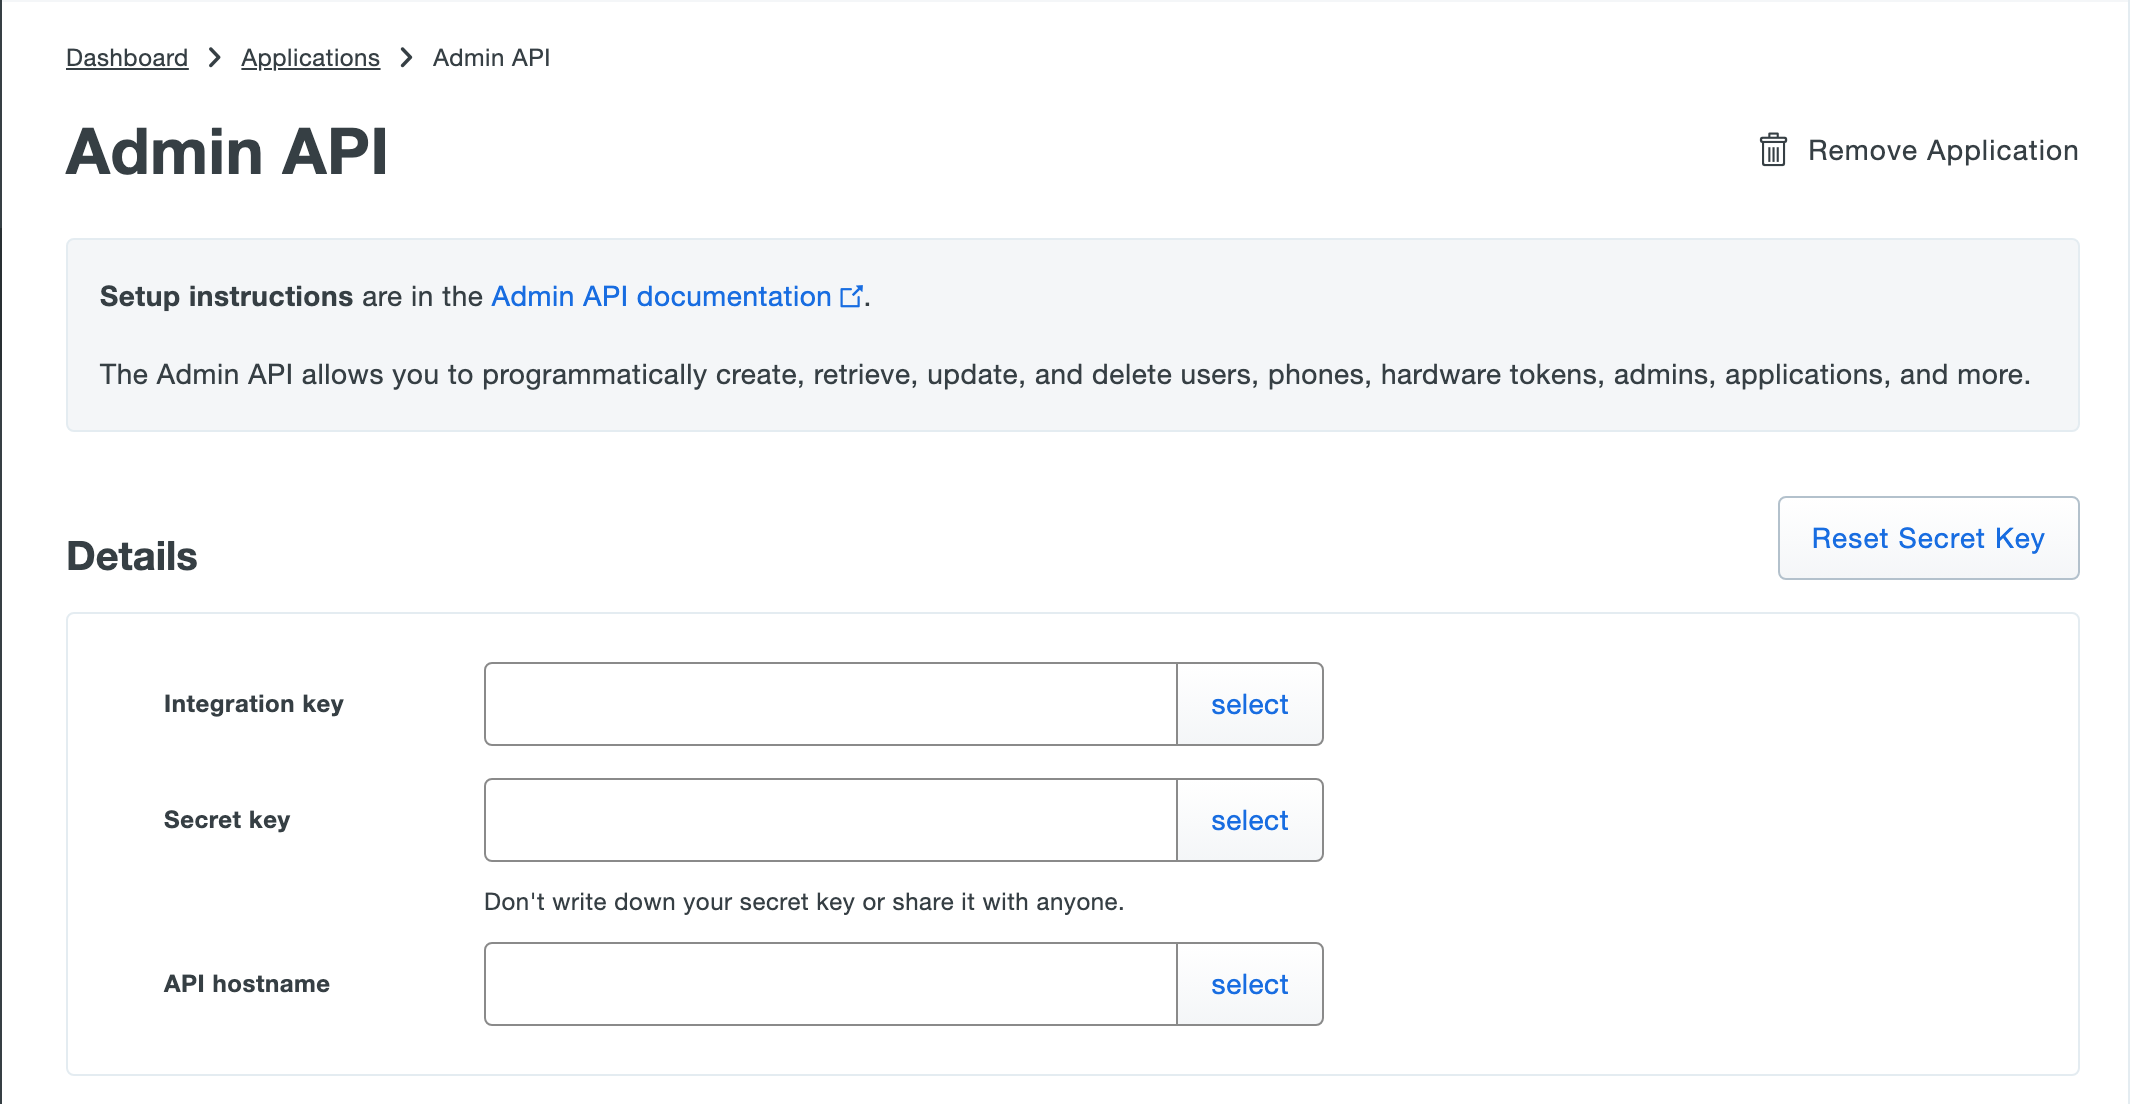
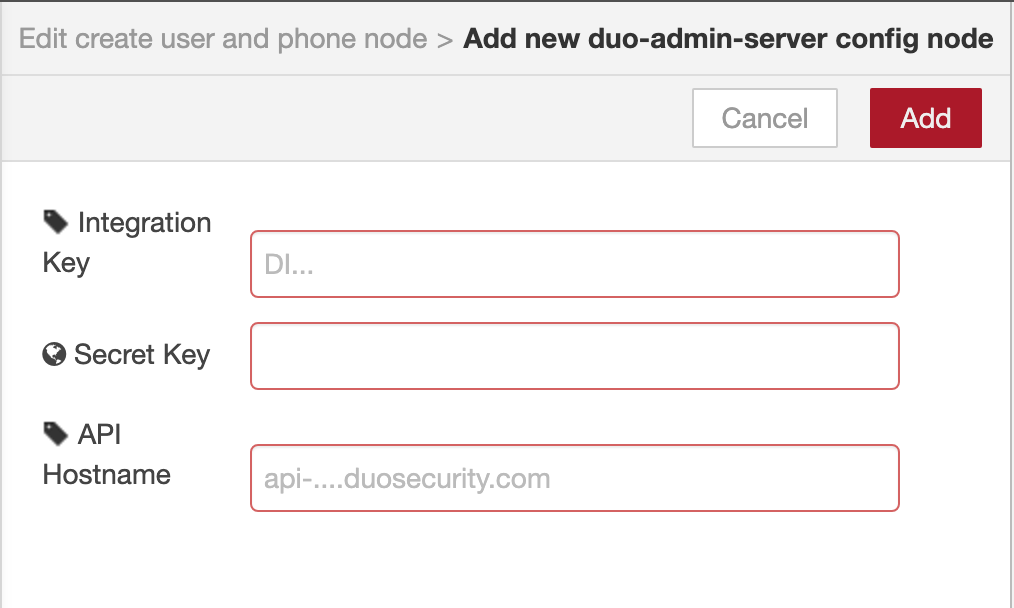
- 4. Prepare Credentials
Copy the Integration Key, Secret Key, API Hostname from Application Details:
- 5. Navigate to DTonomy Panel
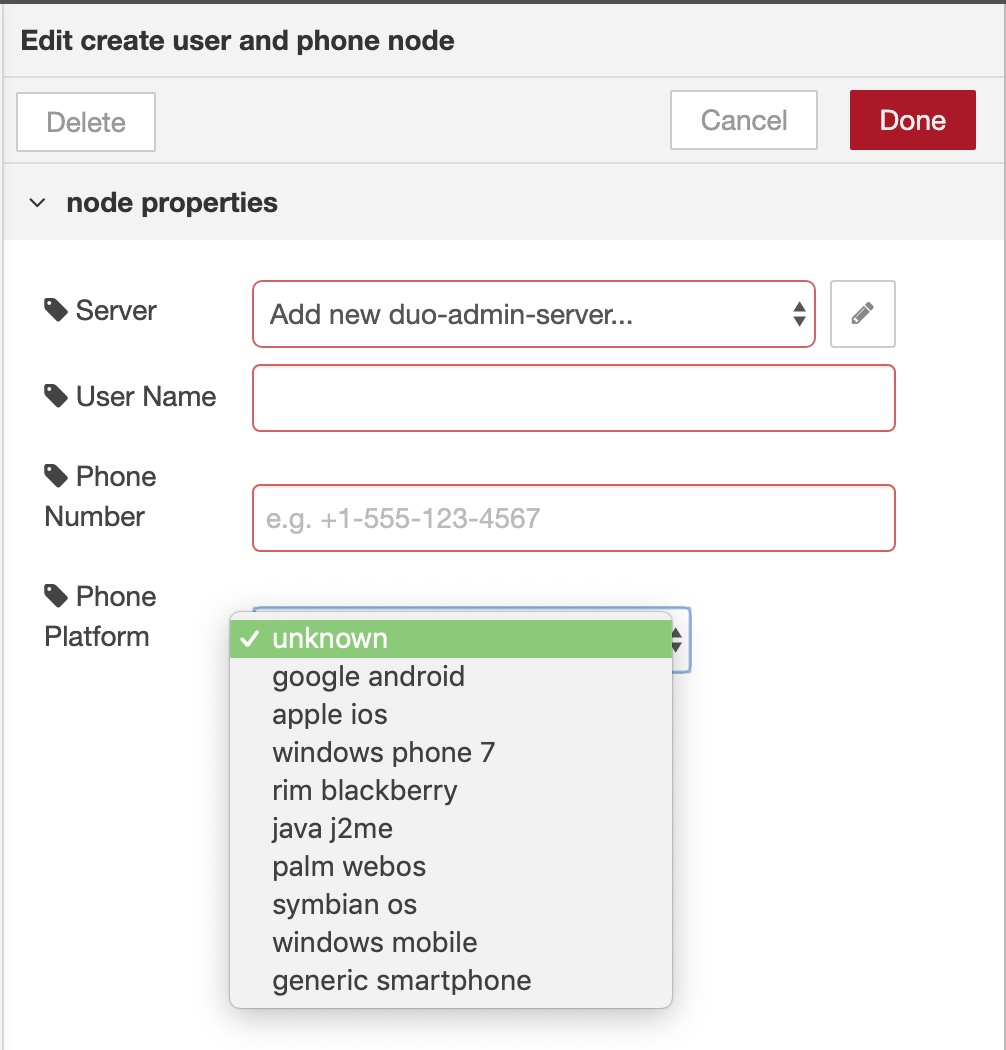
5.1 Search and drag “create user and phone” from left panel to palette.
5.2 Configure Duo Admin Server with information in step 4:
5.3 Configure username, phone number and phone platform:
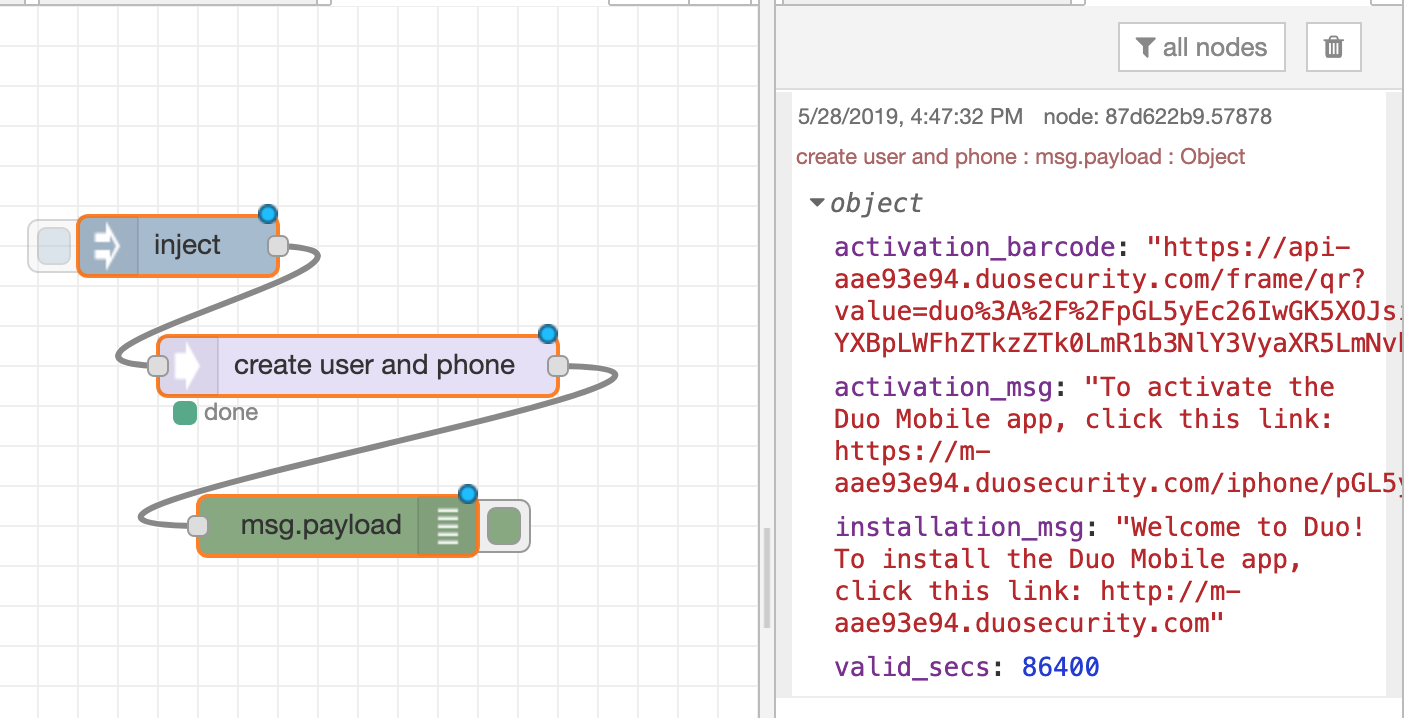
- 6. Result
After add user and phone to Duo, you can validate result:
6.1 From DTonomy panel:
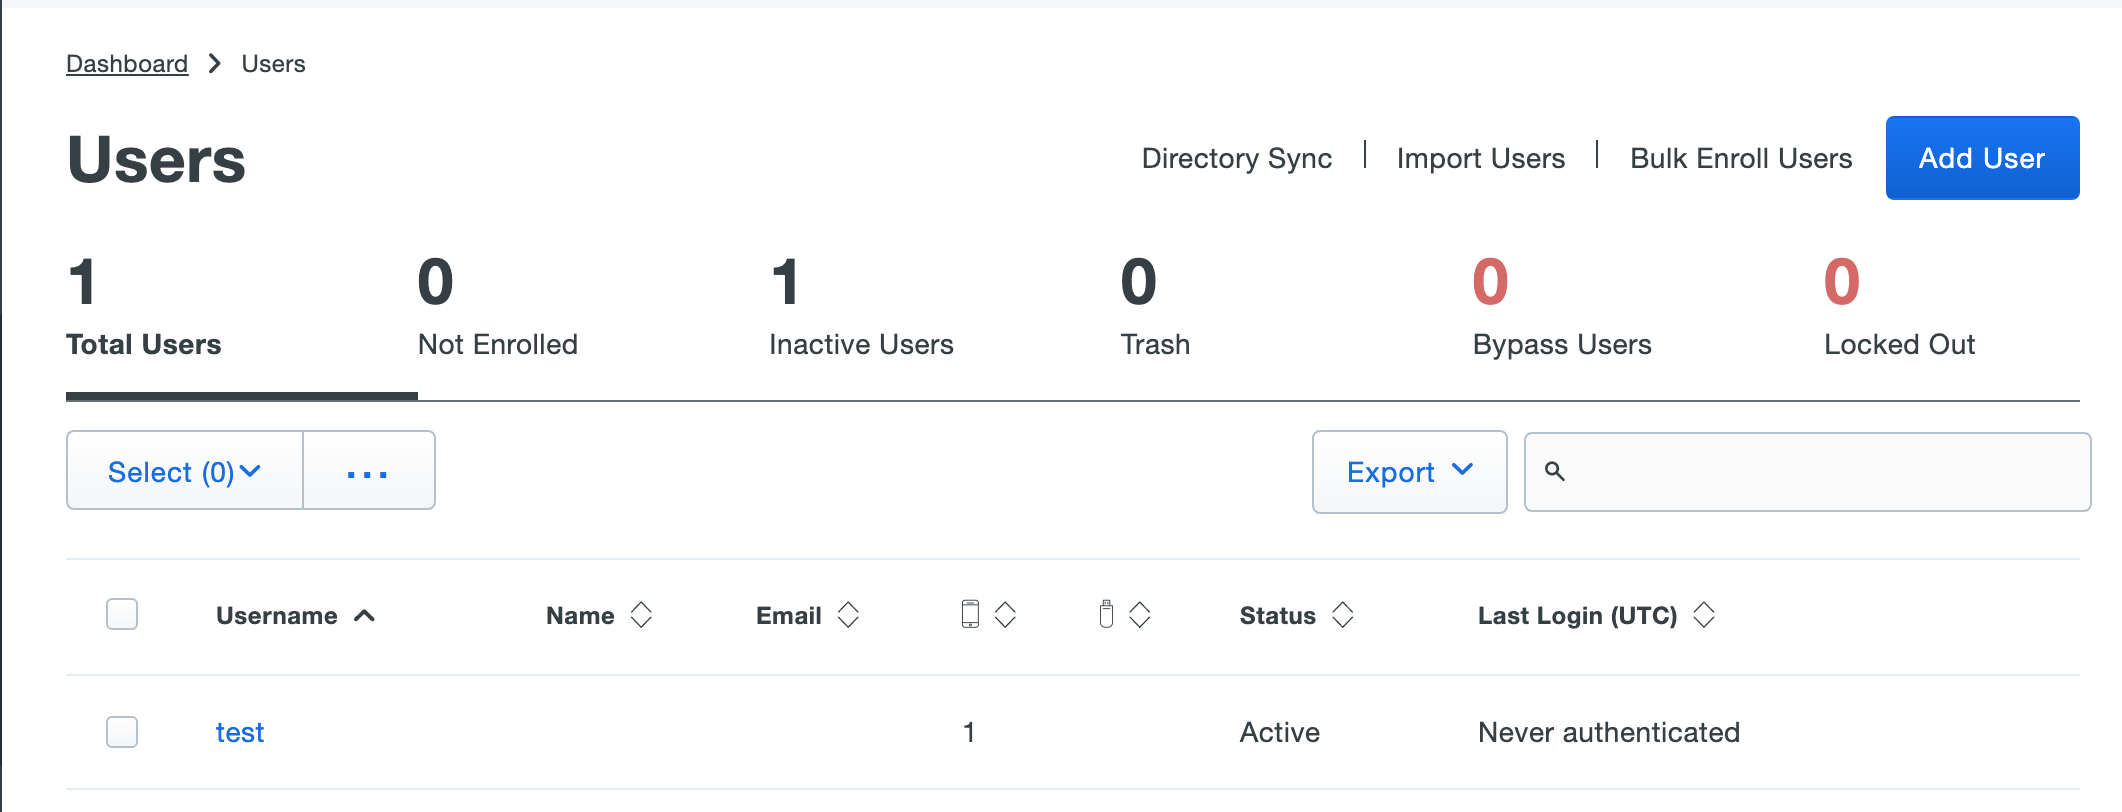
6.2 From Duo Dashboard -User:
6.3 From the registered phone number:
Elasticsearch
Actions supported :
- Elasticsearch
The Elasticsearch Node lets users integrate with Elasticsearch’s functionality: users can query their (log) data within Elastic Cloud. (Ref: https://www.elastic.co/guide/en/elasticsearch/reference/current/index.html).
- 1. Log in/ Sign up your Elastic Cloud Account
- Simply log into your desired Elastic Cloud account https://cloud.elastic.co/login.
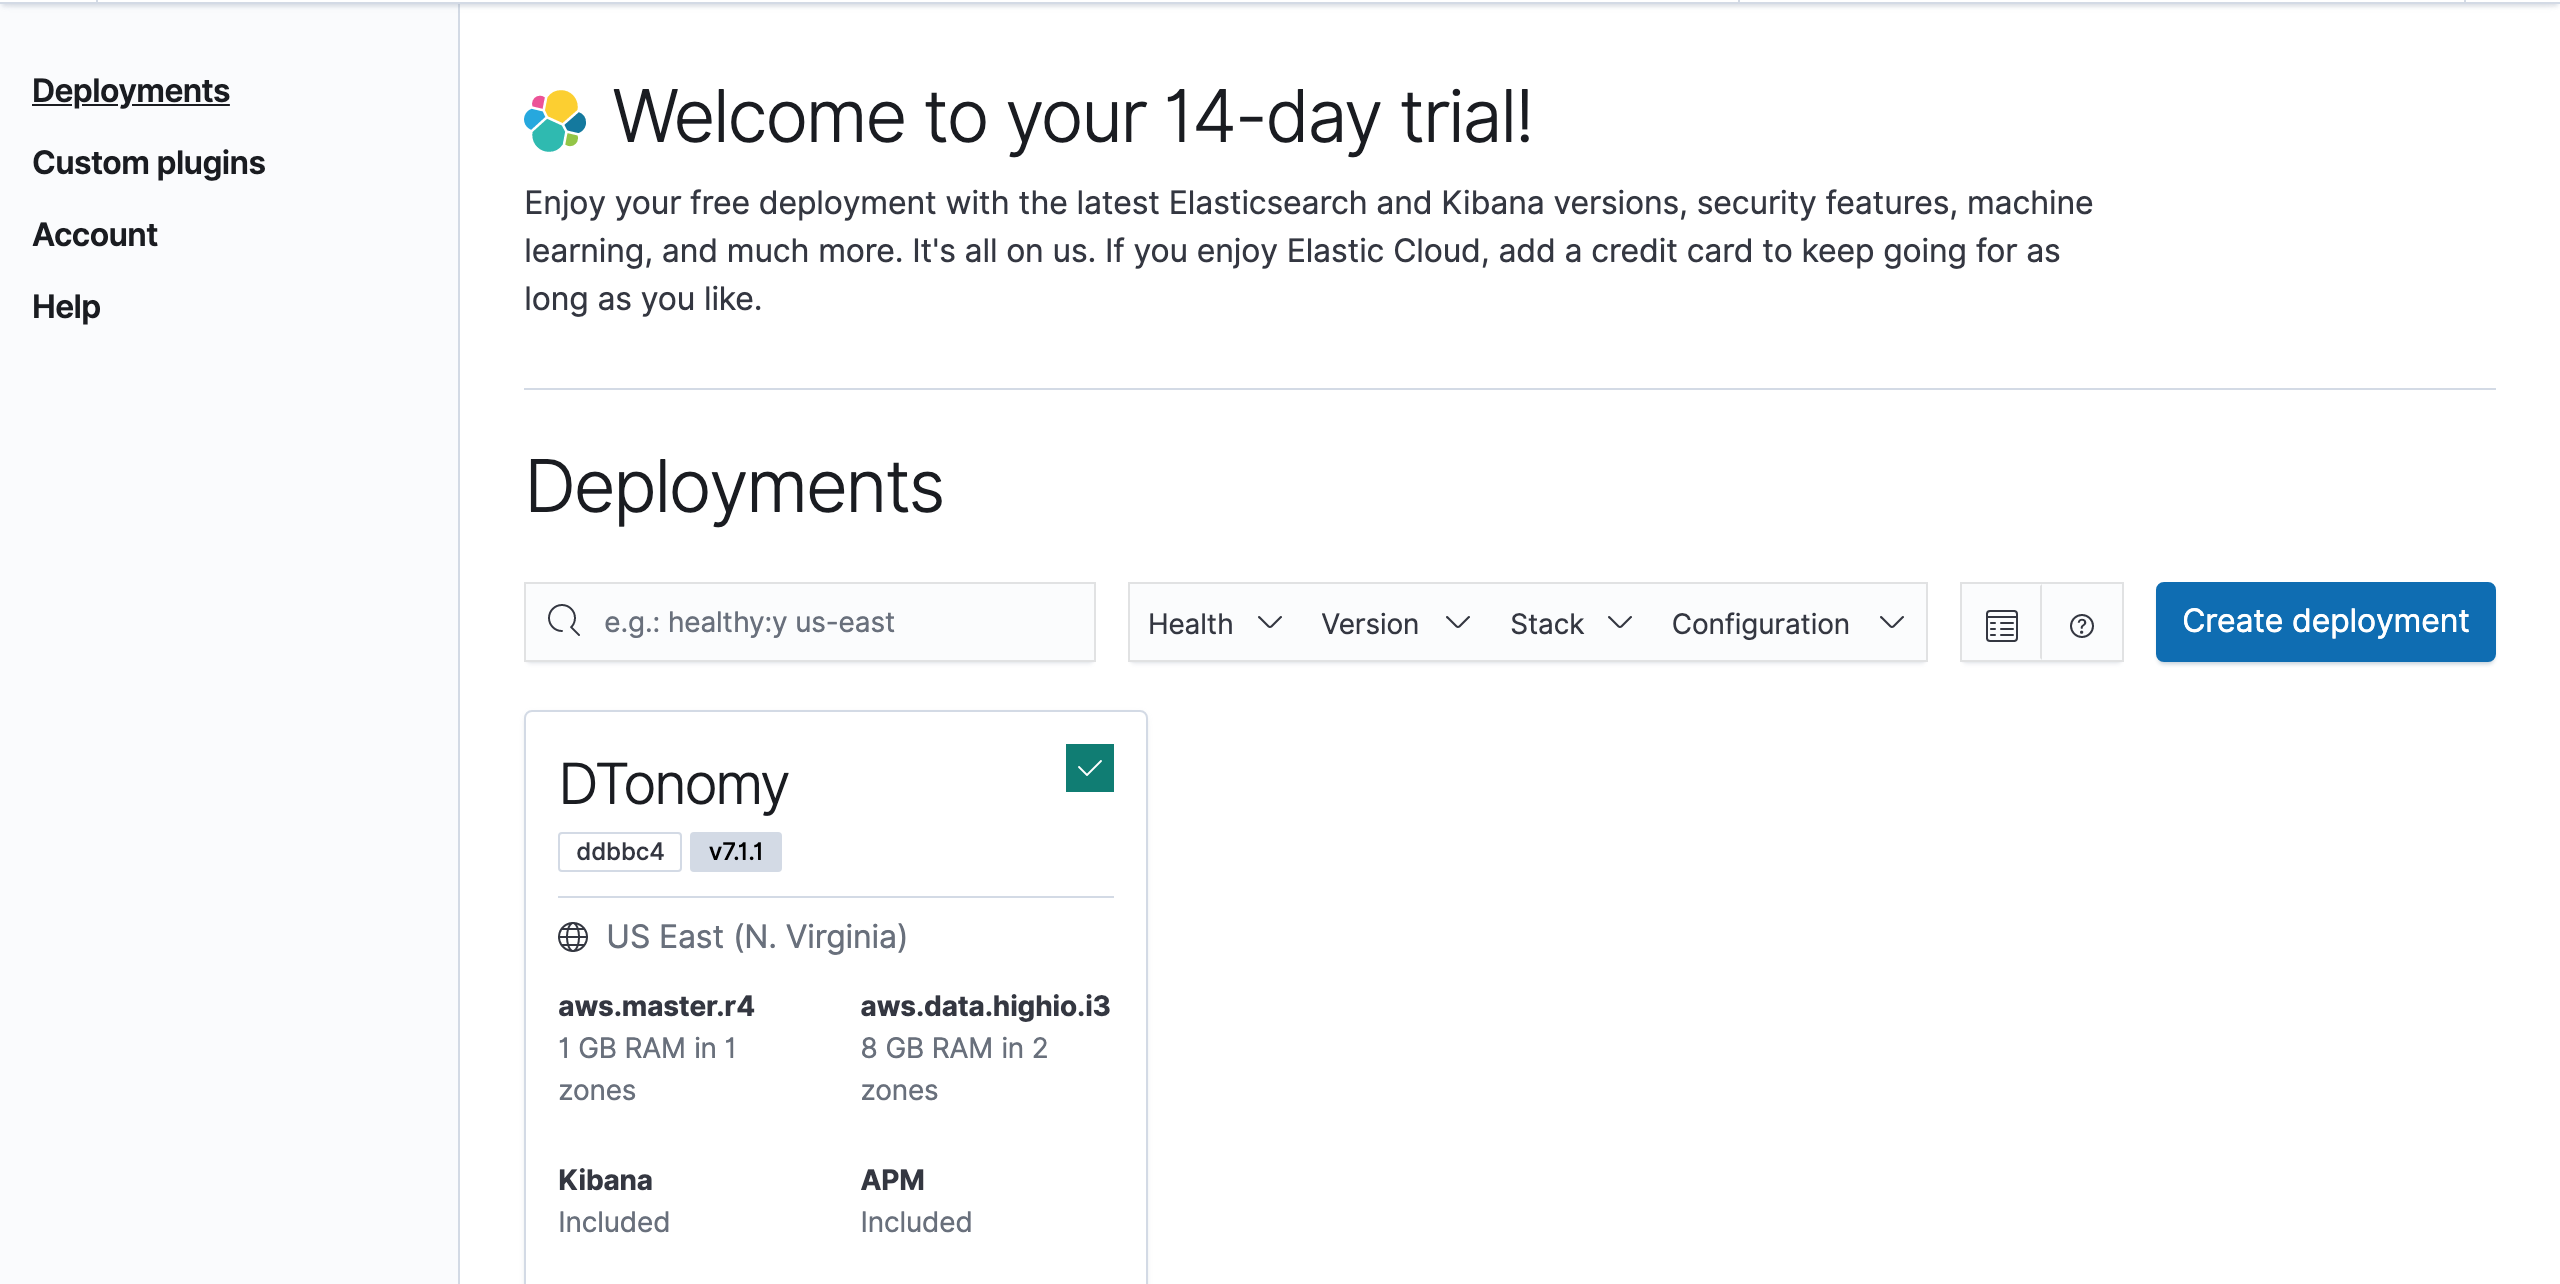
- 2. Create a new Deployment, if you already have one, skip this step
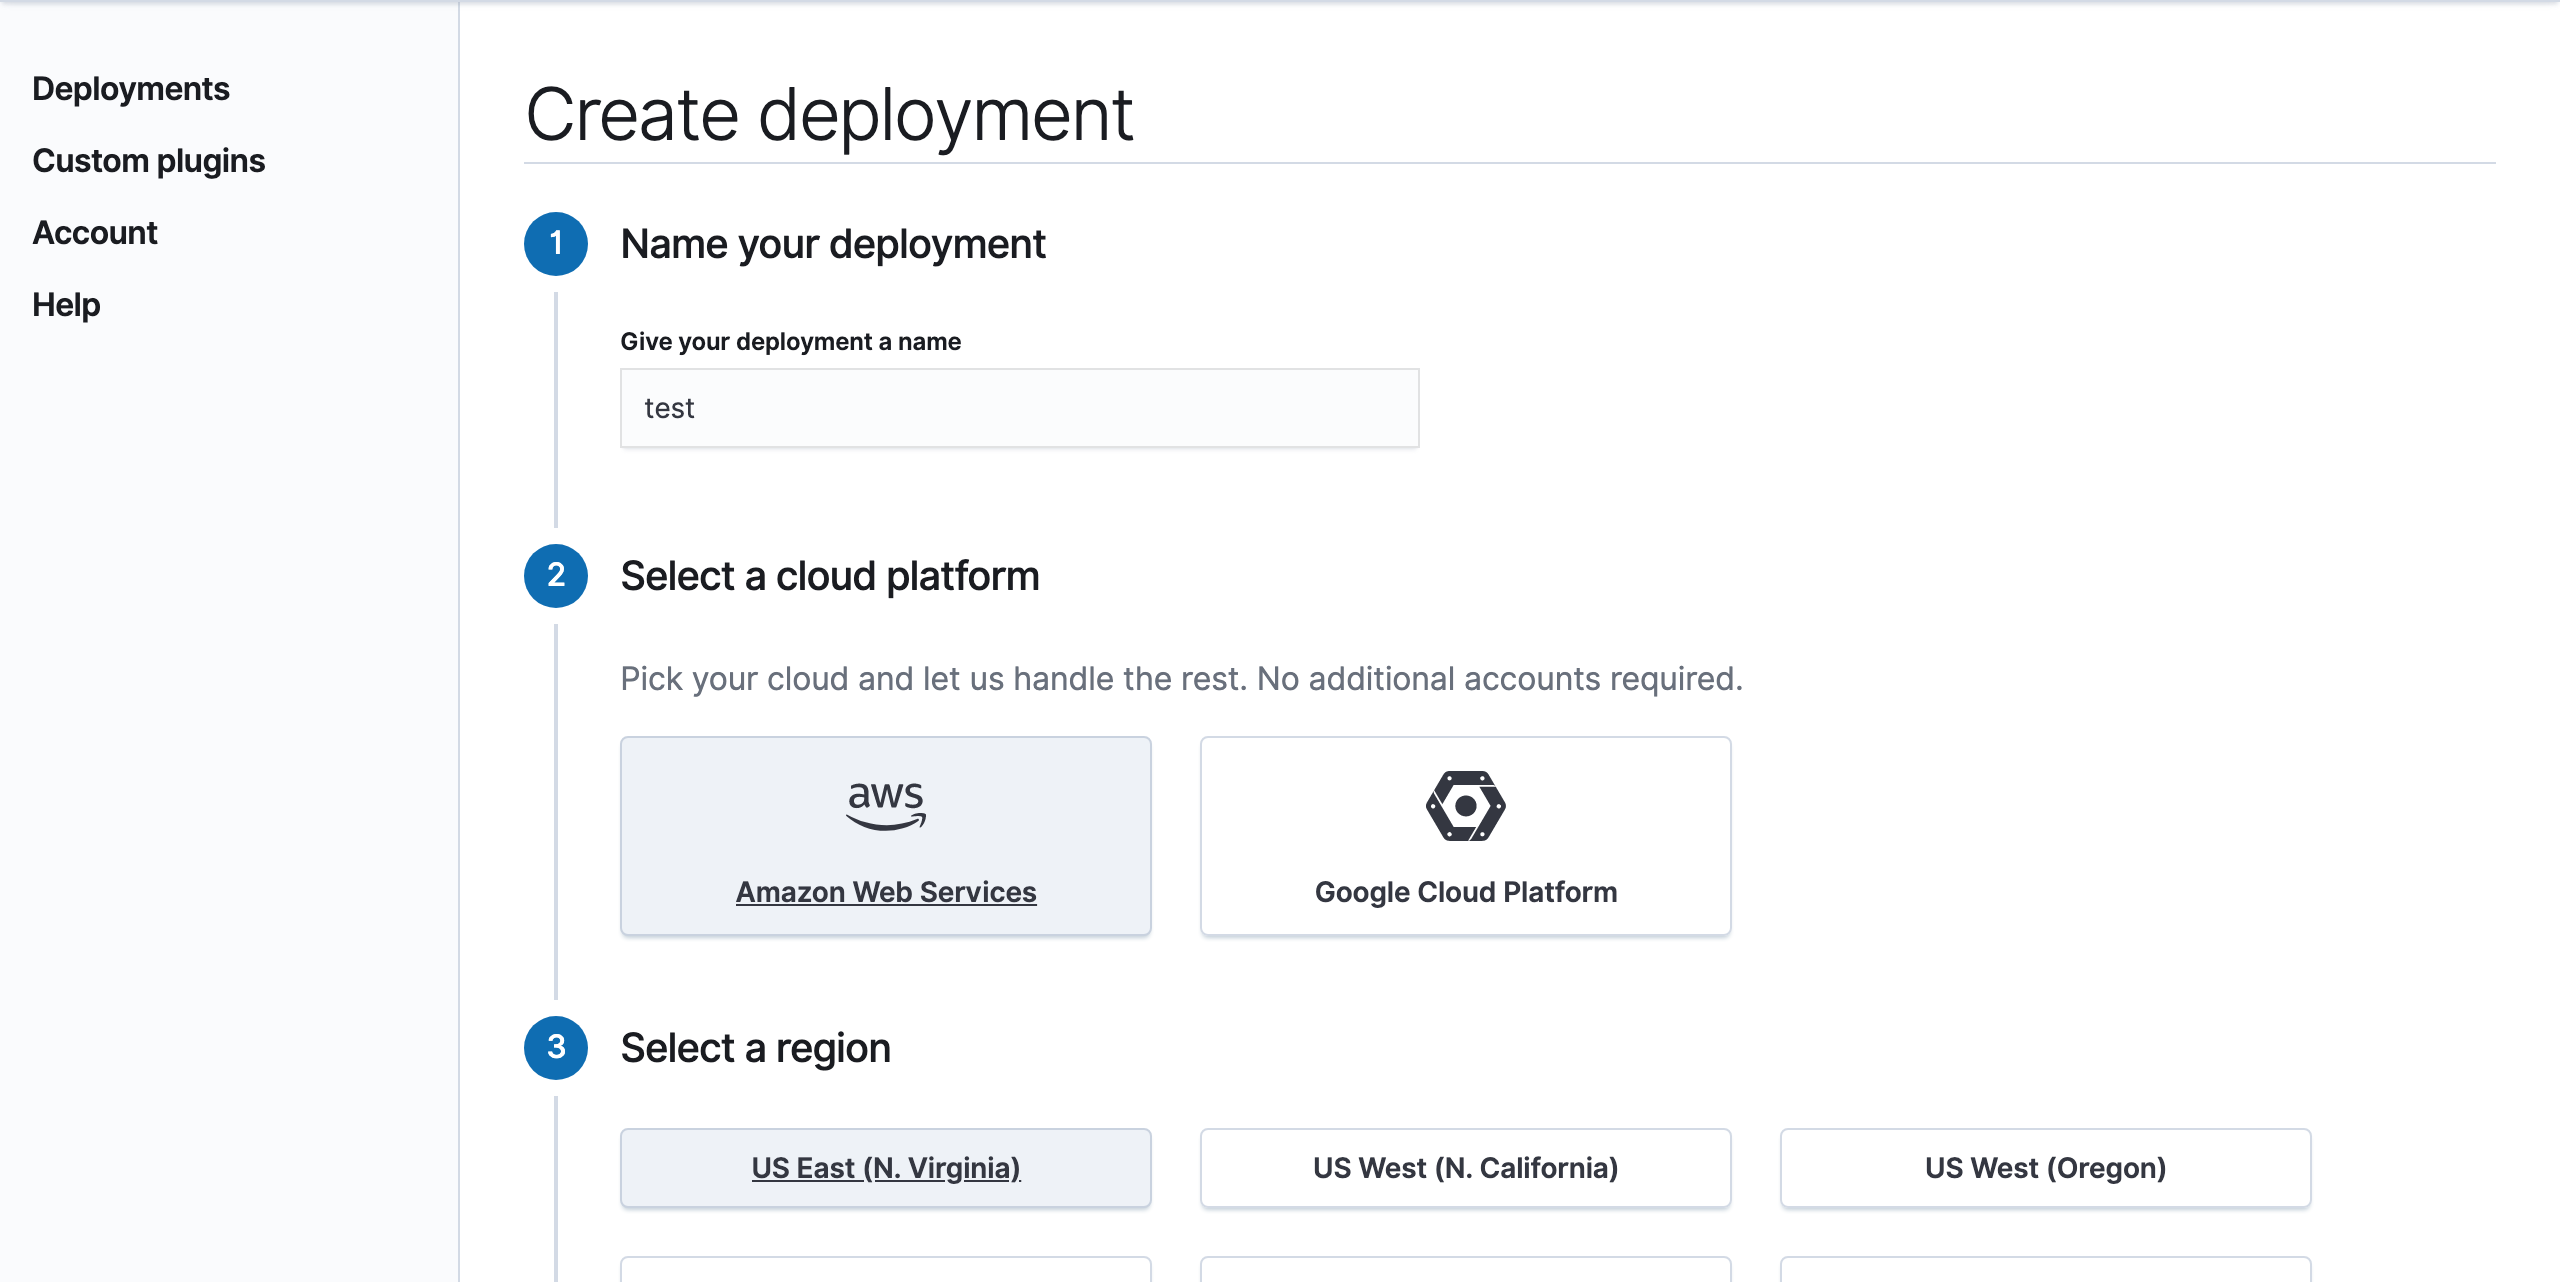
2.1 Click Deployment sidebar, and click “Create Deployment”:
2.2 Fill in the deployment configuration entries:
- 3. Secure your cluster with authentication
3.1 Click on the Configure Shield link on the Overview page.
3.2 Create additional users and/or configure existing usernames and passwords: such as “DTonomy_admin” as username.
3.3 If you added new users, configure their roles, such as configuring “DTonomy_admin” user with admin role.
3.4 Save the usernames and password.
- 4. Load data into your cloud cluster, if you already have loaded data, skip this step
- 4.1 An example of loading data into Elastic Cloud with Logstash: https://www.elastic.co/blog/building-cloud-sandbox-with-sample-data-v2.
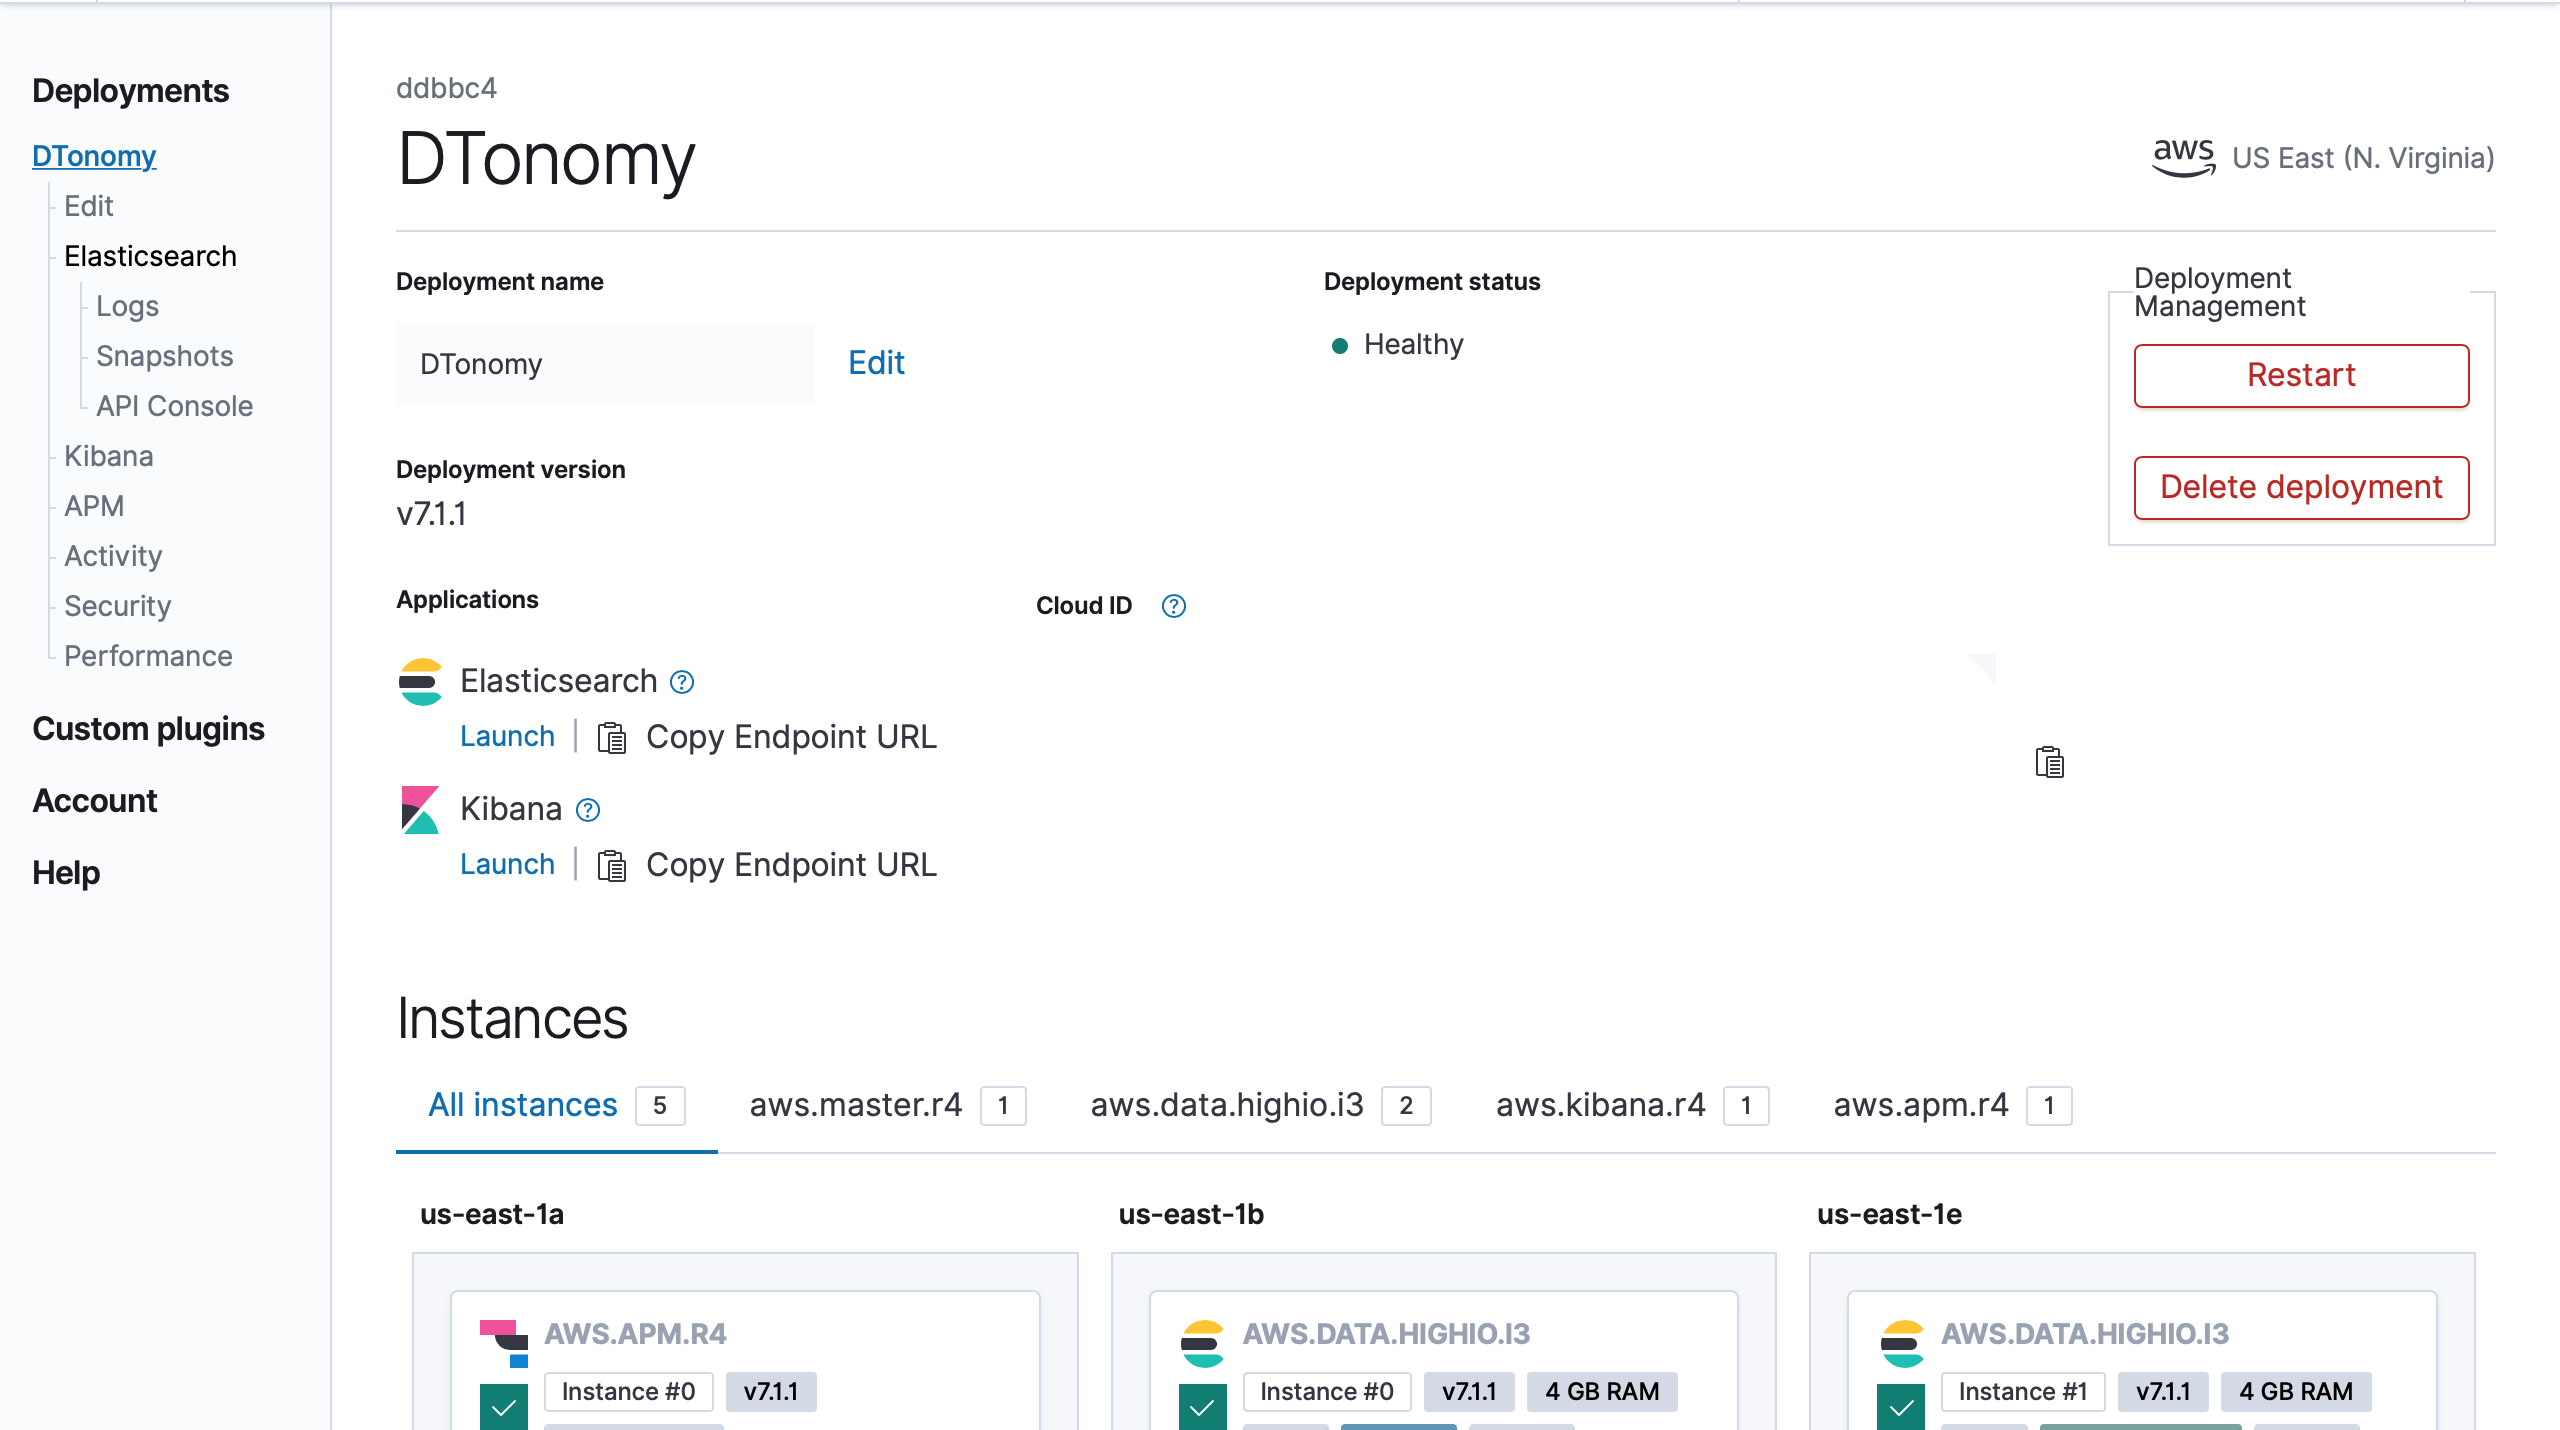
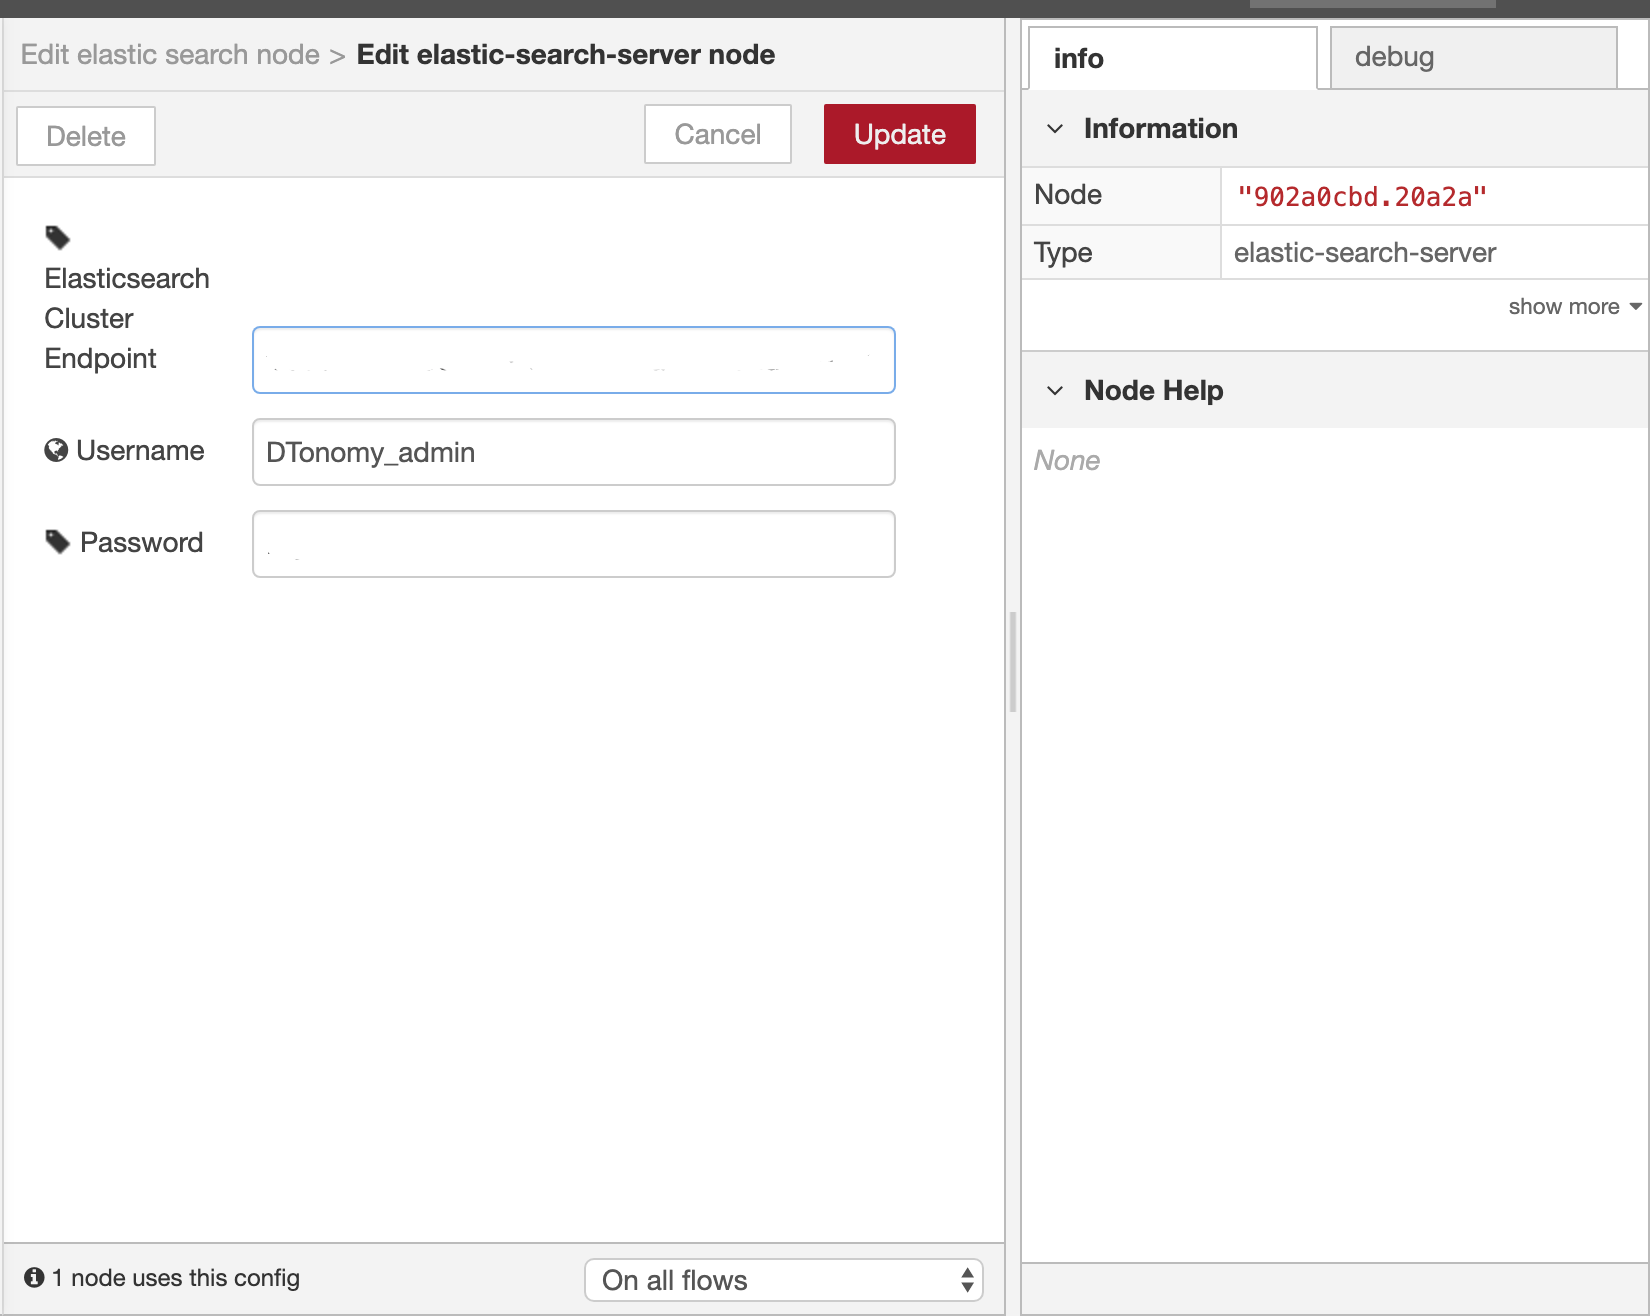
- 5. Prepare Credentials
Copy the ES Endpoint URL from your deployment:
- 6. Navigate to DTonomy Panel
6.1 Search and drag “elastic search” from left panel to palette.
6.2 Configure Elasticsearch Server with information in step 3.4 and 5:
- 6.3 Configure index and query:
For example, search _id = “tP0hMGsB1Efh_gwyA215” from index “apache_elastic_example”:
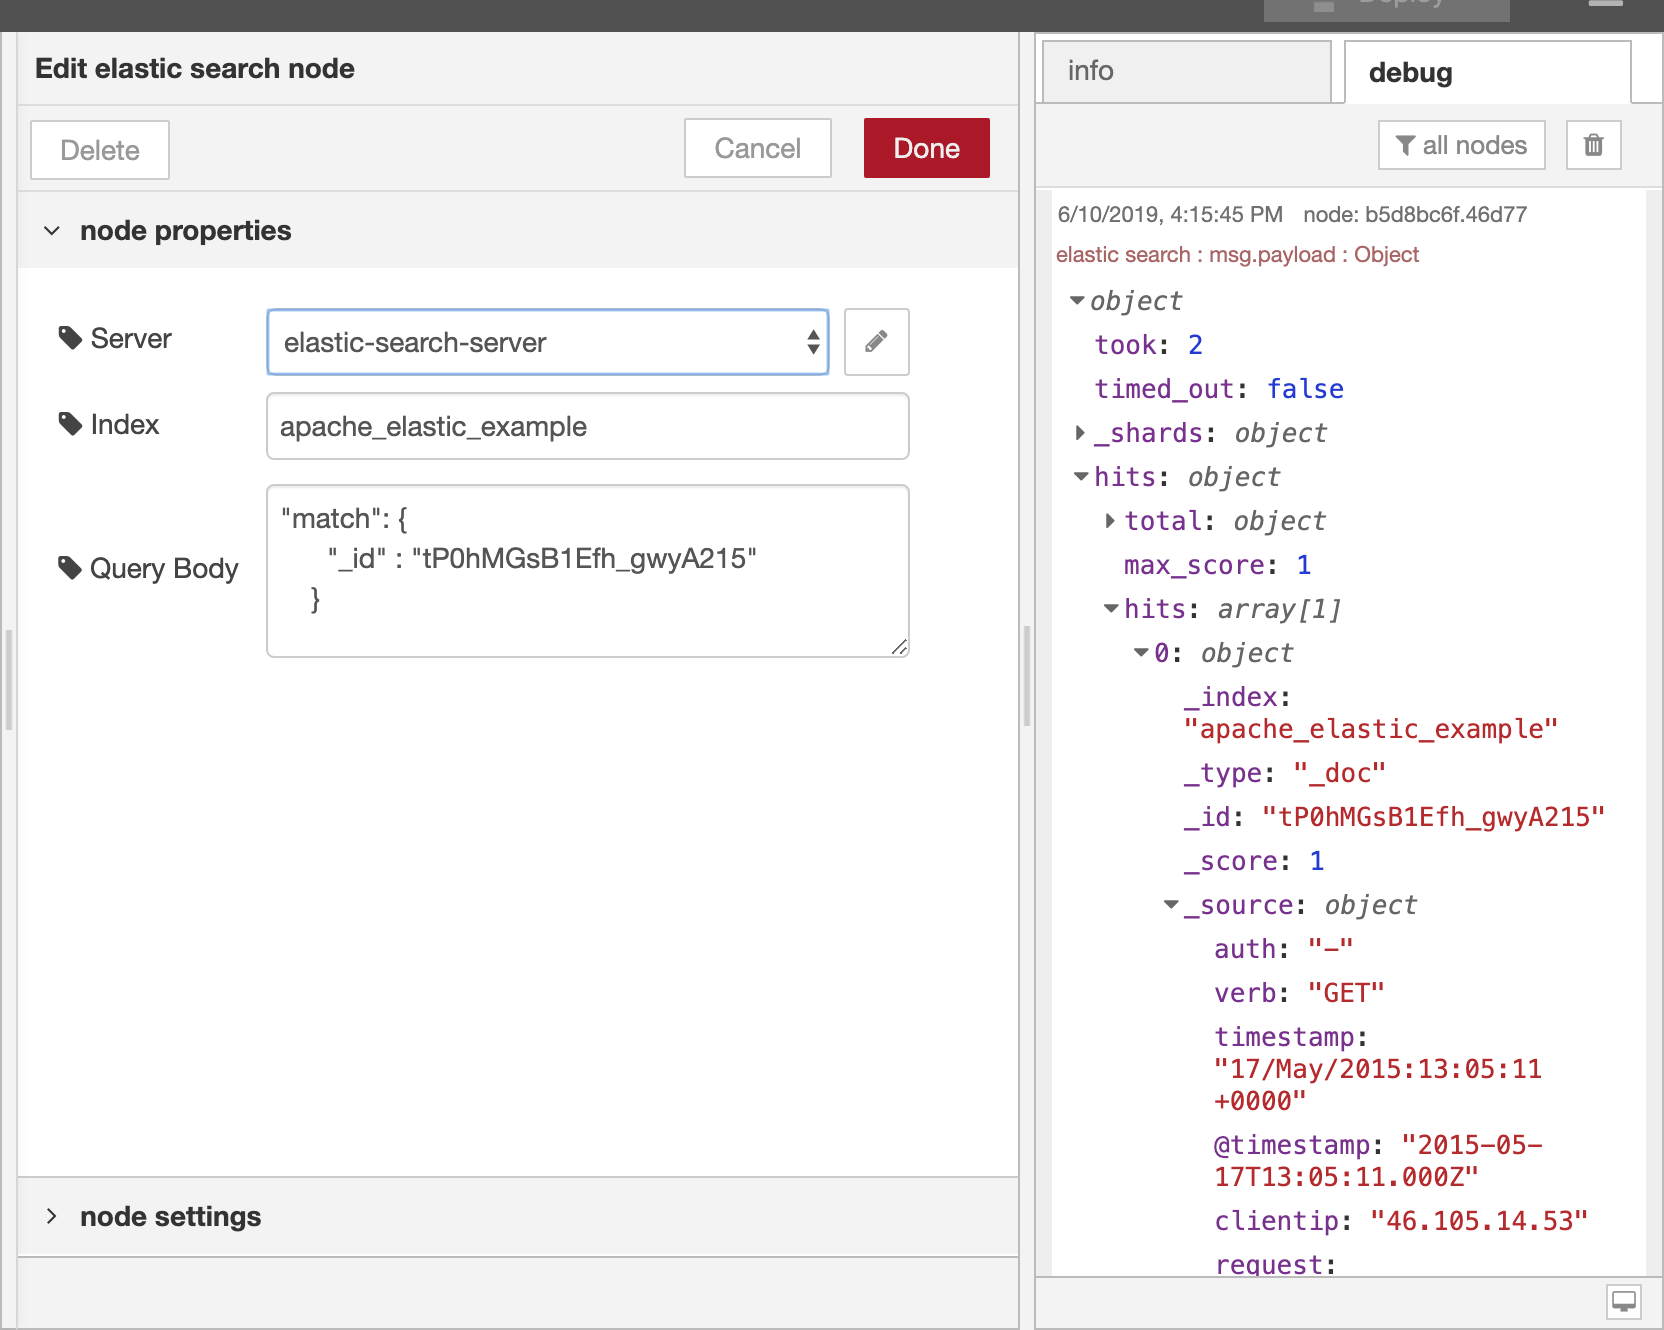
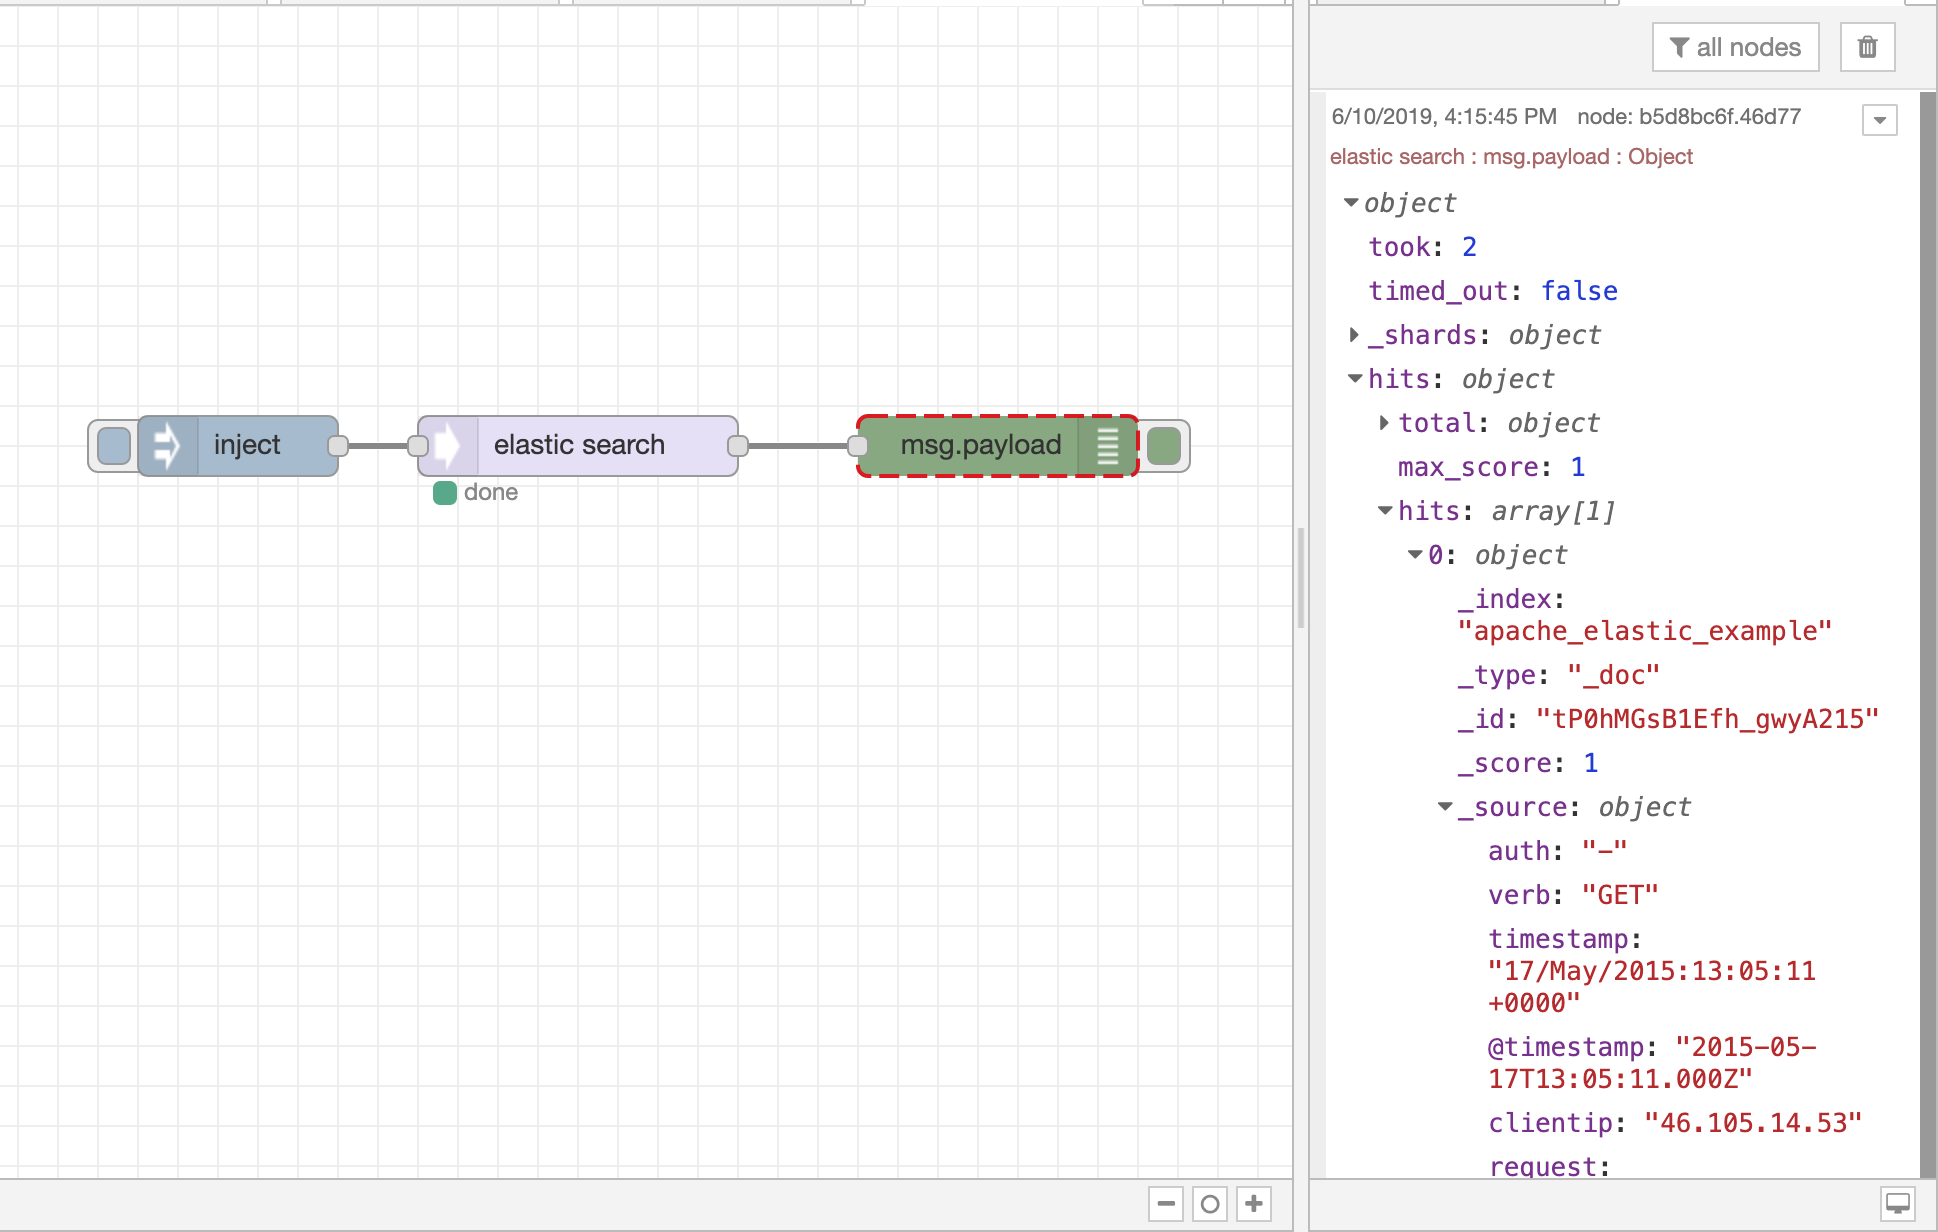
- 7. Result
Result can be found in:
7.1 From DTonomy panel:
Filter
Actions supported :
- whitelist
- blacklist
- yara
whitelist
This node will allow only items present in the whitelist.
- blacklist
- This node won’t allow items present in the blacklist.
- yara
- With YARA you can create descriptions of malware families (or whatever you want to describe) based on textual or binary patterns.
GitHub
Actions supported :
- read data
read data
Get text from GitHub repository. Enter a token if accessing a private repository.
Grouper
Actions supported :
- get subject
- add member
get subject
Look up Subject From Grouper.
add member
Add members to the group in Grouper.
Have I Been Pwned
Connecting with HaveIBeenPwned service and supports:
- get breach
get breach
verify whether an email is comprised or not
Hybrid Analysis
Actions supported :
- scan url
- scan url to file
- search hash
- scan ip
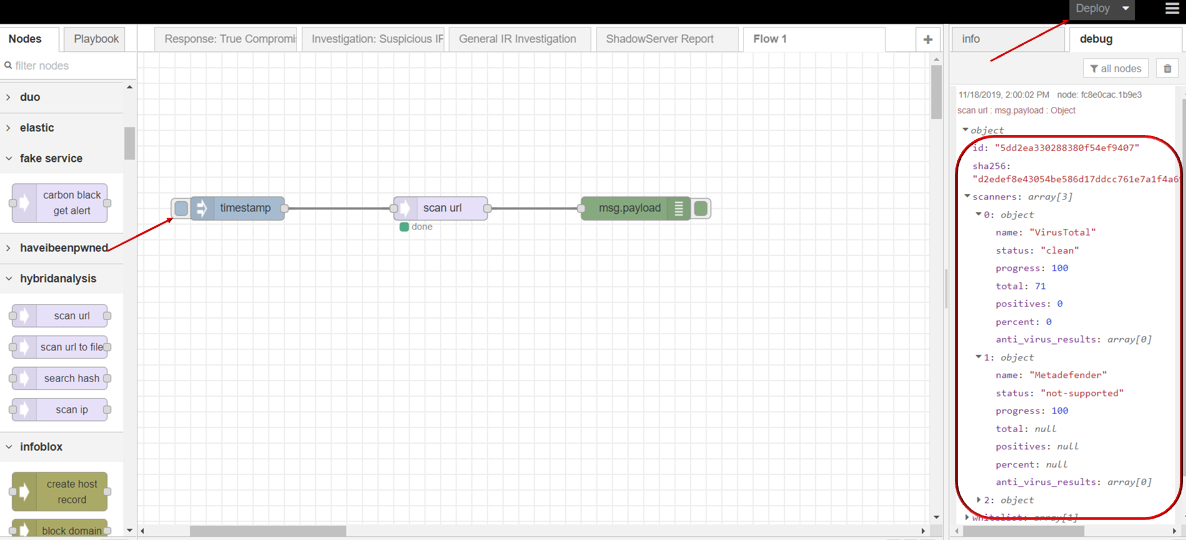
scan url
scan url node supports users to scan url security status through Hybrid Analysis.
- scan url
- Drag INJECT, SCAN URL under HYBRID ANALYSIS, DEBUG node from palette to Workspace, connect in order.
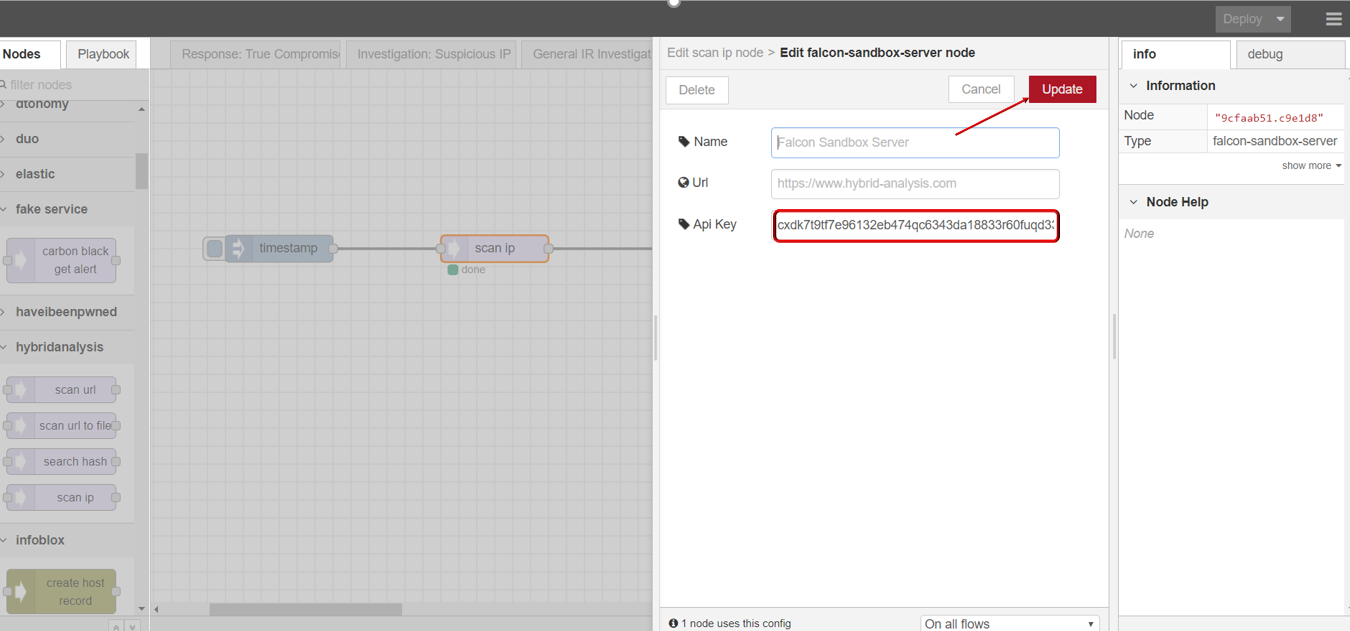
- Double click SCAN URL node,click to edit Server with your API key, then click Update button .
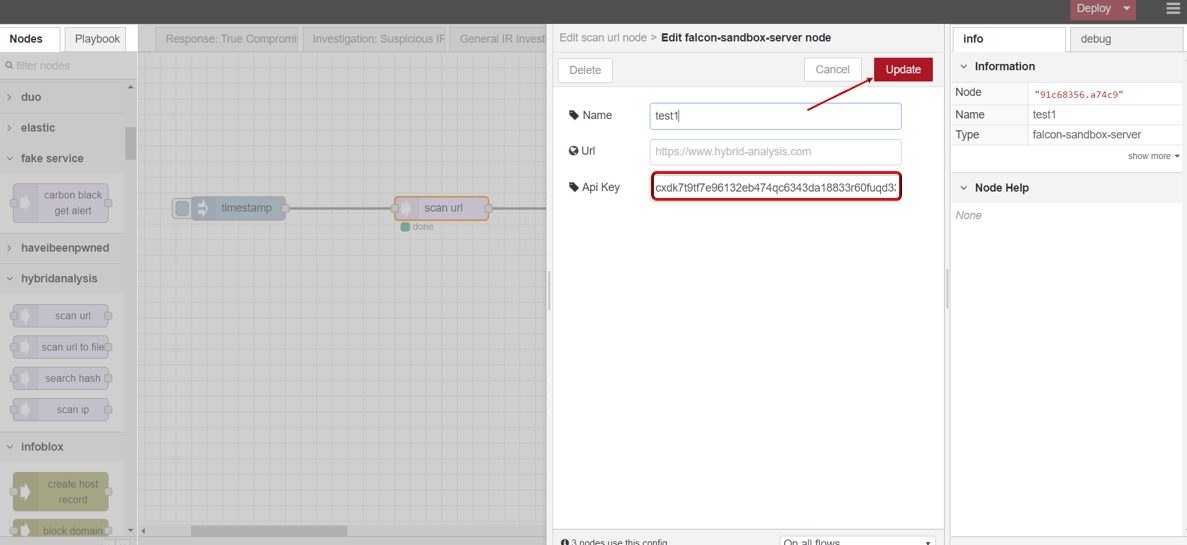
- Enter url you want to scan .
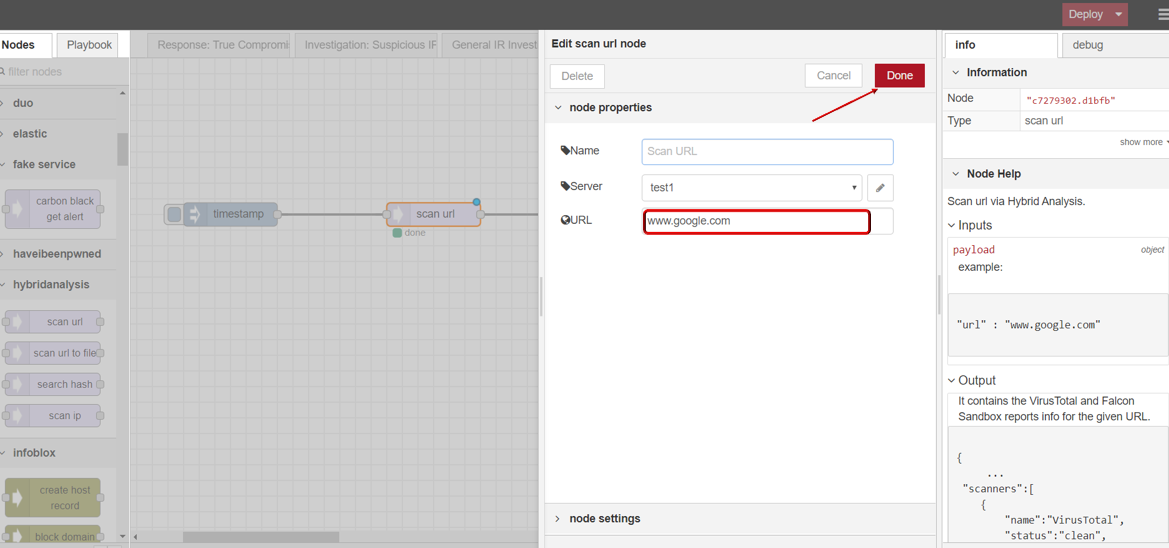
- Click Save button, then click INJECT button with DEBUG sidebar tab open, scan result is shown in the debug window if succeed.
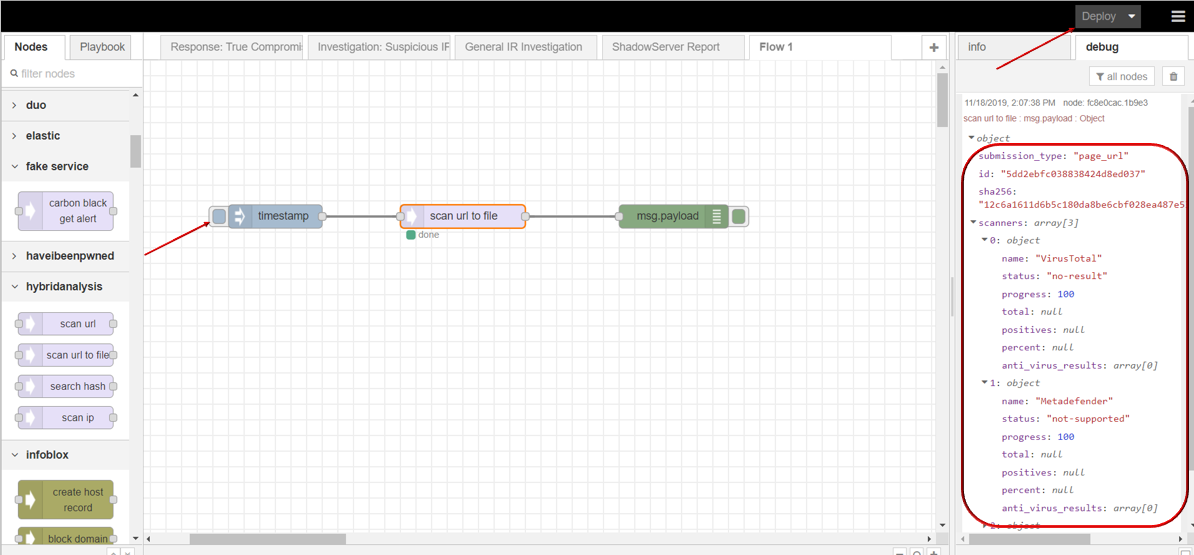
scan url to file
scan url to file node supports user to scan file’s url link security status through Hybrid Analysis.
- scan url to file
- Drag INJECT, SCAN URL TO FILE under HYBRID ANALYSIS, DEBUG node from palette to Workspace, connect in order.
- Double click SCAN URL TO FILE node,click to edit Server with your API key, then click Update button .
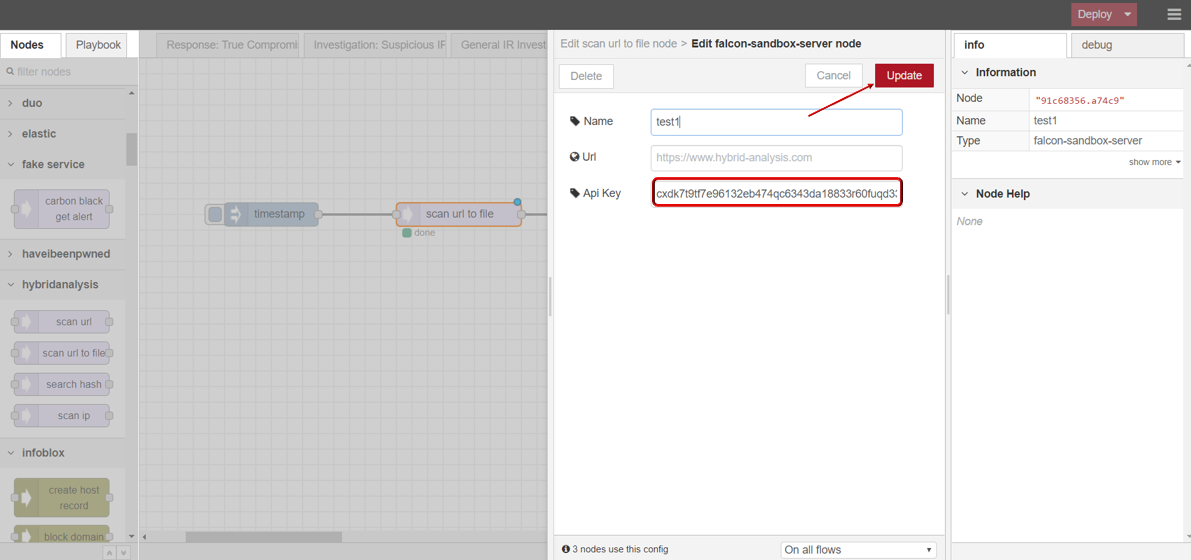
- Enter file url link you want to scan .
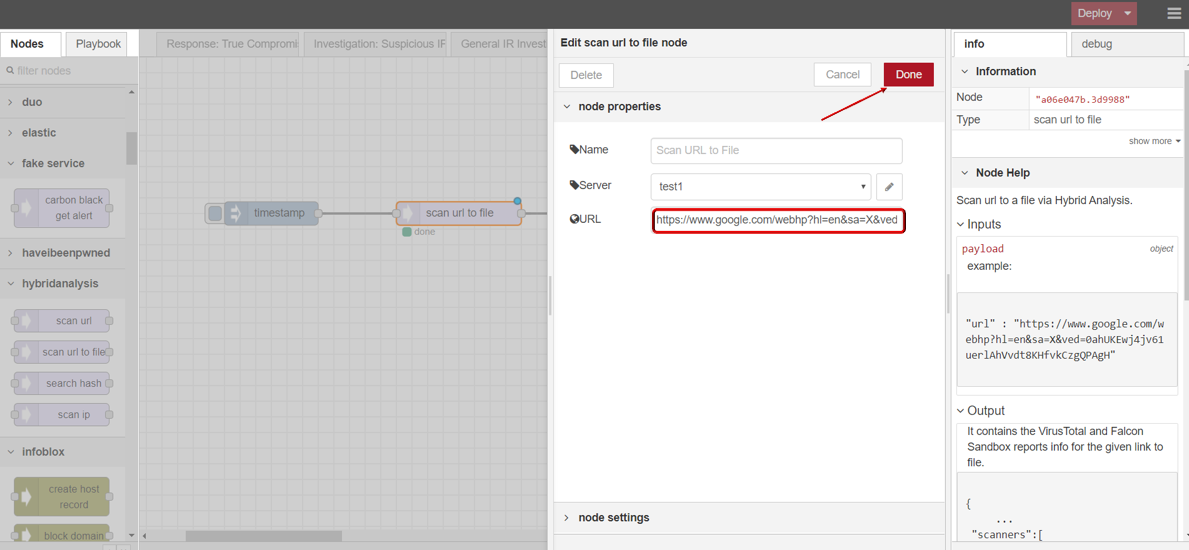
- Click Save button, then click INJECT button with DEBUG sidebar tab open, scan result is shown in the debug window if succeed.
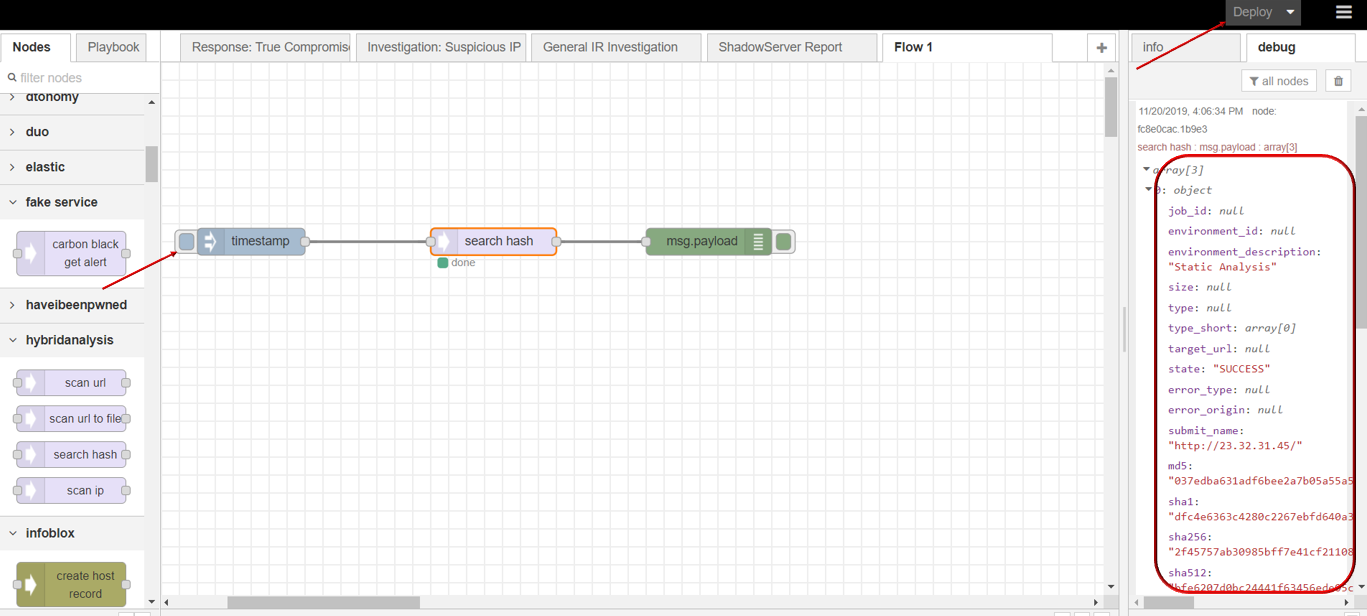
search hash
search hash node supports user to scan hash security status through Hybrid Analysis.
- search hash
- Drag INJECT, SEARCH HASH under HYBRID ANALYSIS, DEBUG node from palette to Workspace, connect in order.
- Double SEARCH HASH node,click to edit Server with your API key, then click Update button .
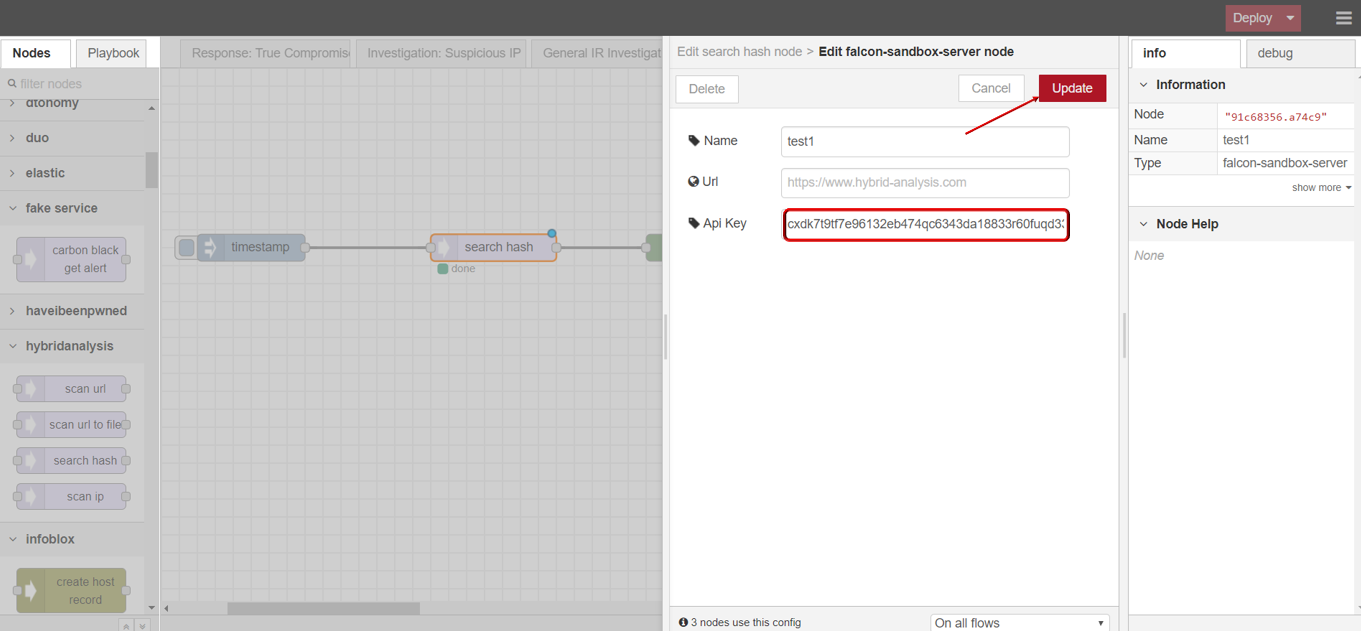
- Enter the hash value you want to scan (Accept hash type: MD5, SHA1 or SHA256).
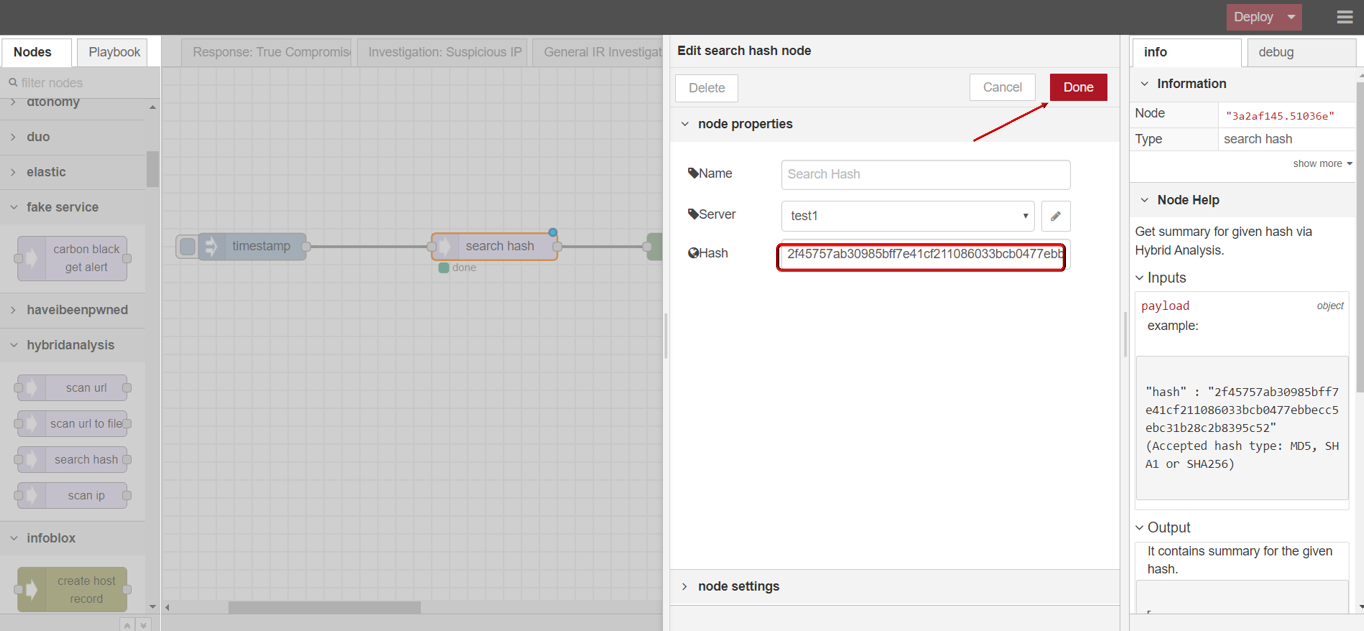
- Click Save button, then click INJECT button with DEBUG sidebar tab open, scan result is shown in the debug window if succeed.
scan ip
scan ip node supports users to scan ip security status through Hybrid Analysis.
- scan ip
- Drag INJECT, SCAN IP under HYBRID ANALYSIS, DEBUG node from palette to Workspace, connect in order.
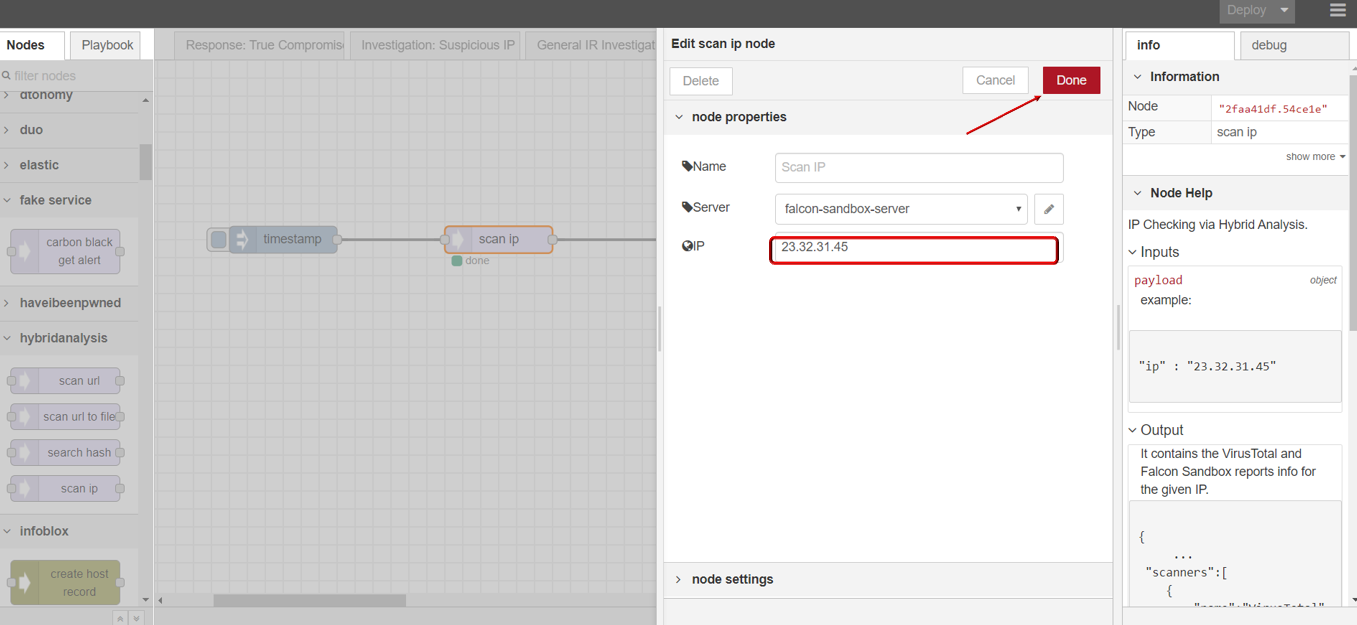
- Double click SCAN IP node,click to edit Server with your API key, then click Update button .
- Enter ip you want to scan.
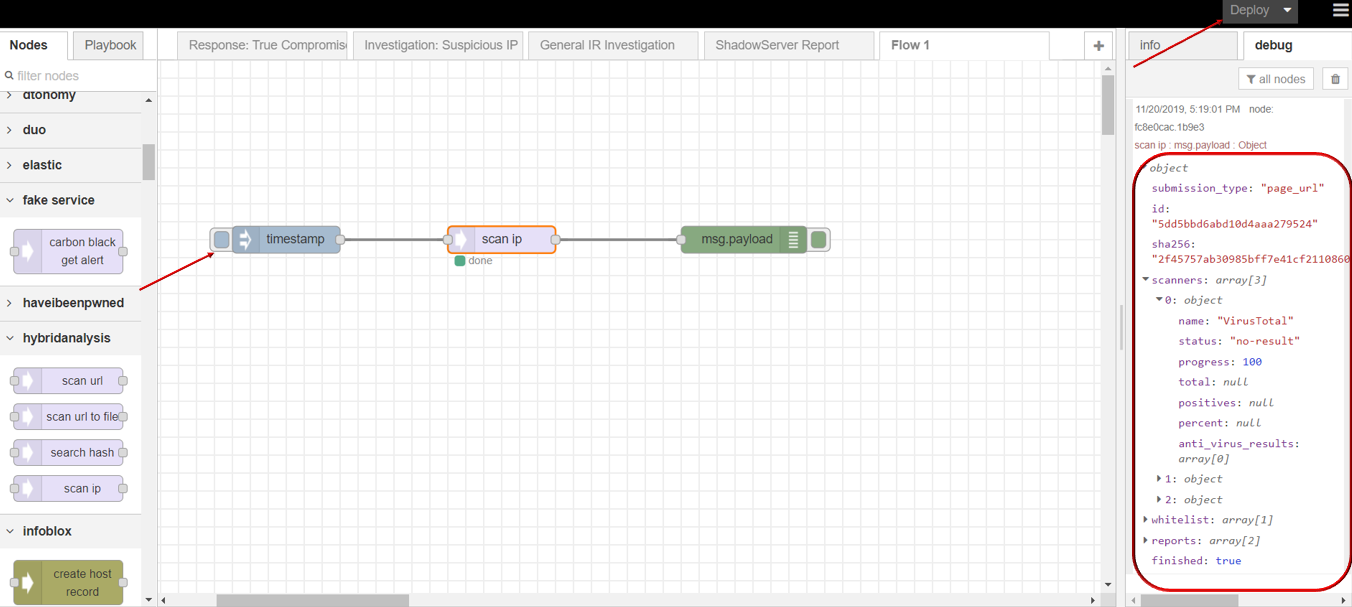
- Click Save button, then click INJECT button with DEBUG sidebar tab open, scan result is shown in the debug window if succeed.
InfoBlox
Connector to InfoBlox Service where you can :
- create host record
- block domain
create host record
Create a host record from InfoBlox.
block domain
Block certain domain from InfoBlox.
Intelligence
Actions supported :
- build intelligence
- get bitbucket alert
build intelligence
Connect to DTonomy server for calculating intelligence.
get bitbucket alert
Retrieve Bitbucket Alert.
Jira
Actions Supported :
- Jira converter
- Jira search
- Jira issue update
- Jira issue get
- Jira issue create
- Jira issue comment add
- Jira issue comment update
Jira converter
Convert other data source to Jira issue format.
Jira search
Perform JQL searches via Jira’s REST API. 0.0.6
Jira issue update
Perform issue updates via Jira’s REST API.
Jira issue get
Get issues via Jira’s REST API.
Jira issue create
Create issues via Jira’s REST API.
Jira issue comment add
Create issues comments via Jira’s REST API.
Jira issue comment update
Update issues comments via Jira’s REST API.
Manageengine
Actions supported :
- install missing patches
install missing patches
Install all missing patches in specific systems.
Microsoft Teams
Actions supported :
- send notifications
send notifications
This node will send notifications to Microsoft Teams.
Network
Actions supported :
- nslookup
- whois
- nmap
- dns
- ip reputation
- ip geo
- bigssh
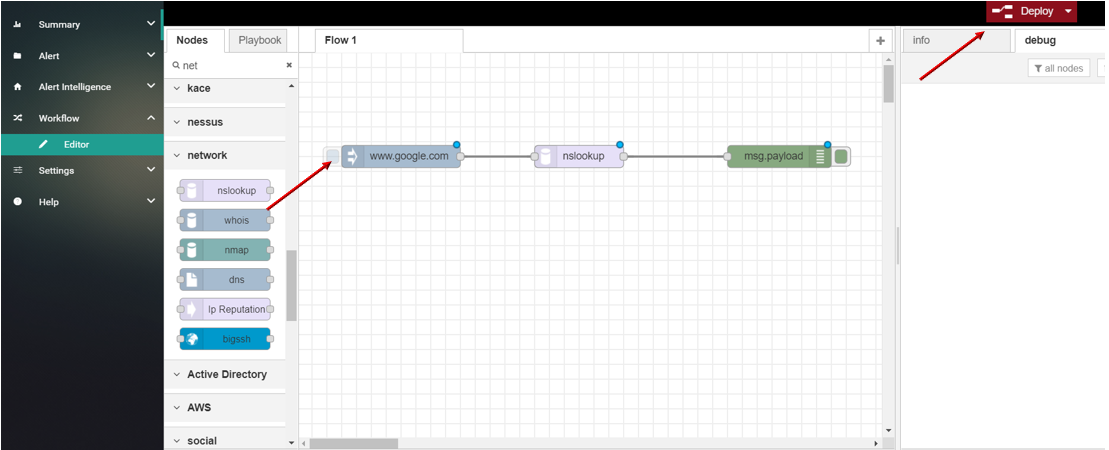
nslookup
This node supports query for IPs using domain name.
- nslookup
- Drag and drop NSLOOKUP node from palette under NETWORK , connect with INJECT node and DEBUG node.
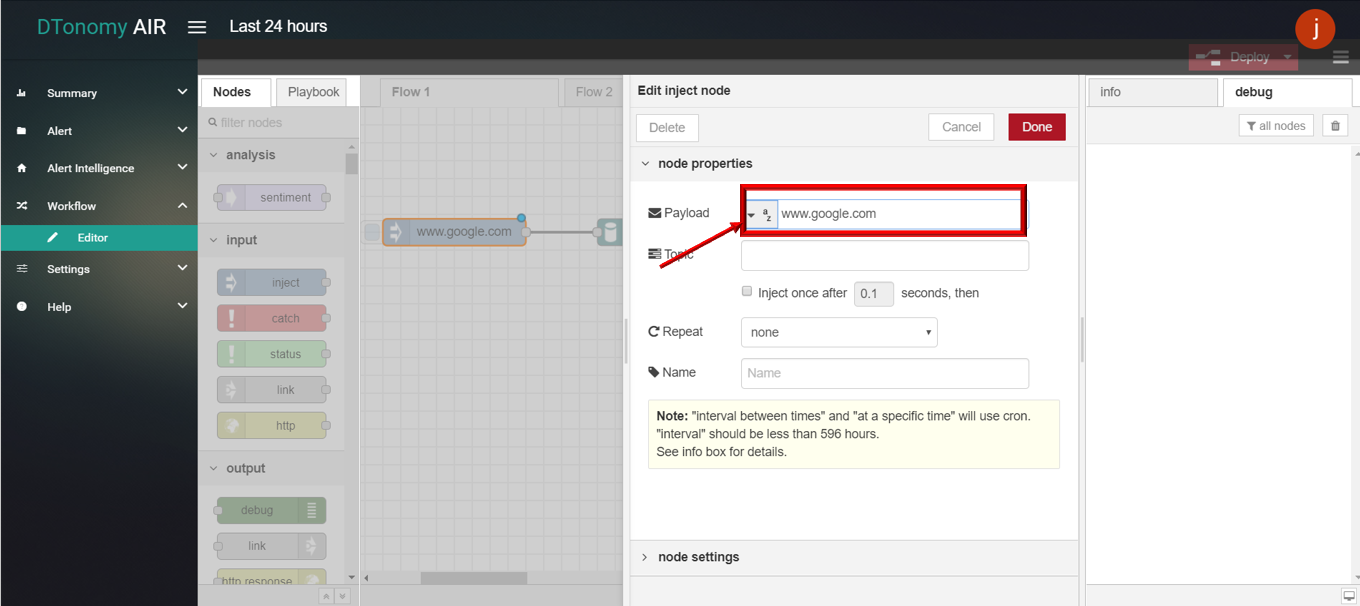
- Double click INJECT node, set Payload to string and enter DNS (for example: www.google.com).
- Click Save button, then click INJECT button with DEBUG sidebar tab open, list of IPs is shown in the debug window.
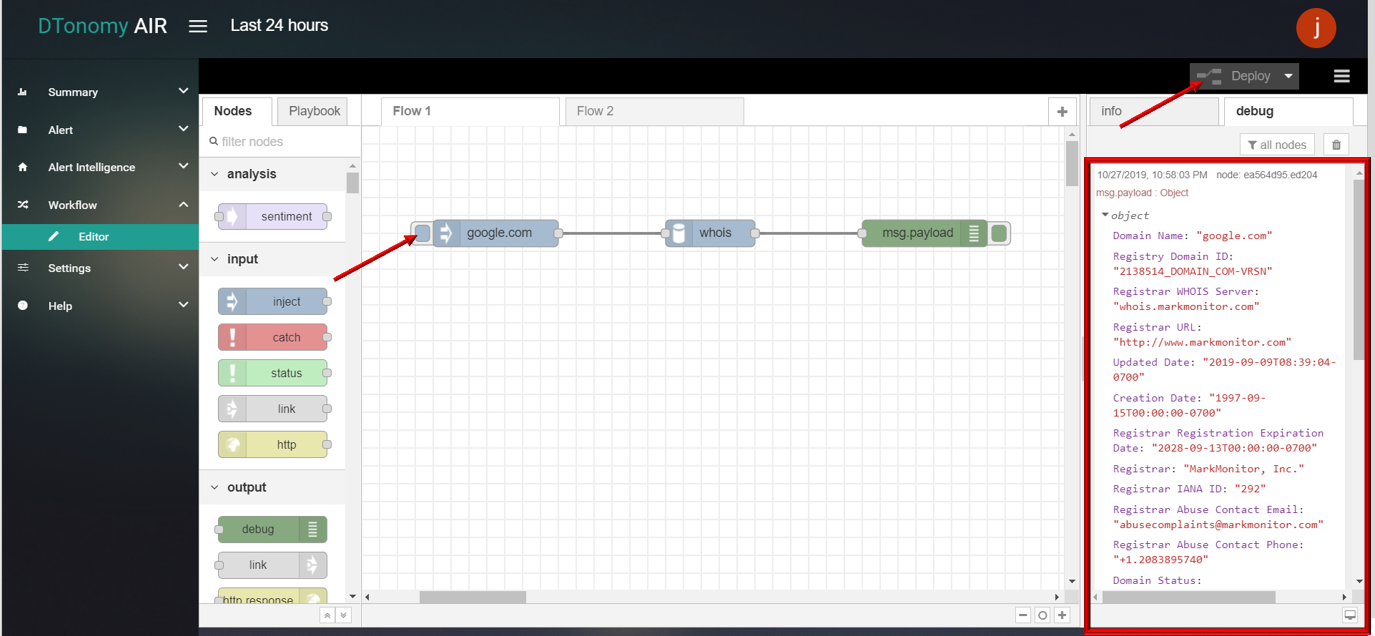
Whois
This node supports query for domain information using domain name.
- Whois
- Drag and drop WHOIS node from palette under NETWORK , connect with INJECT node and DEBUG node.
- Double click INJECT node, set Payload to string and enter DNS (for example: www.google.com).
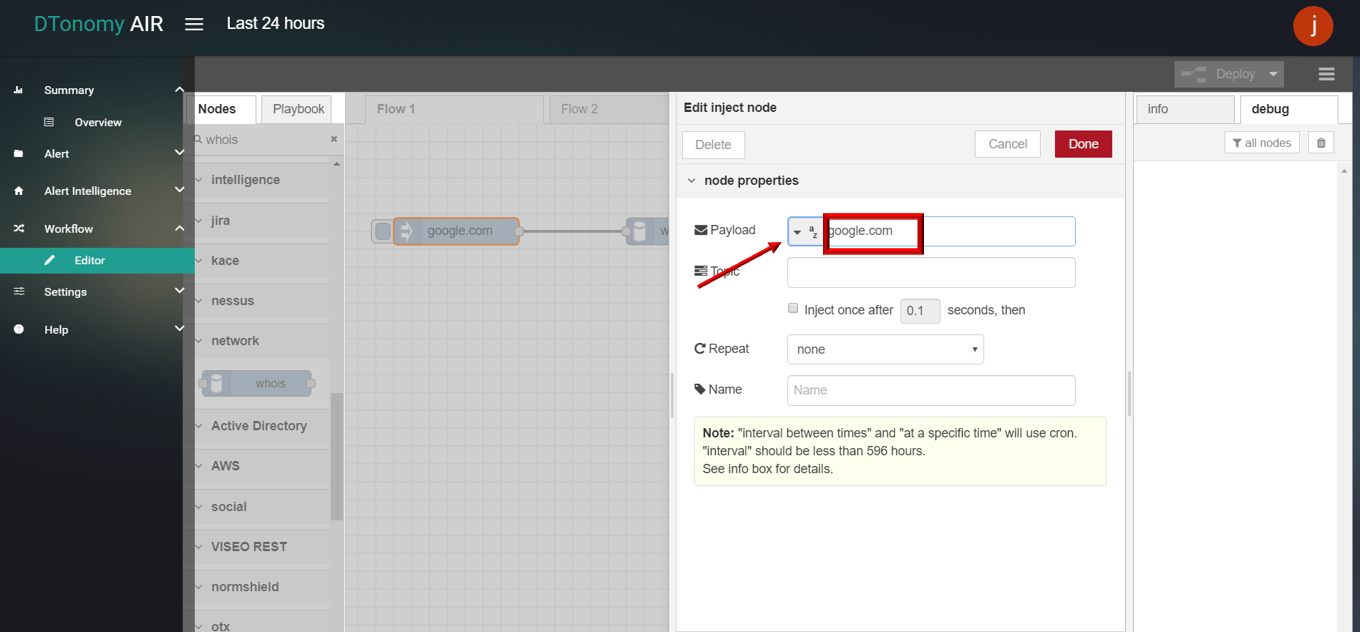
- Click Save button, then click INJECT button with DEBUG sidebar tab open, list of WHOIS protocol information is shown in the debug window.
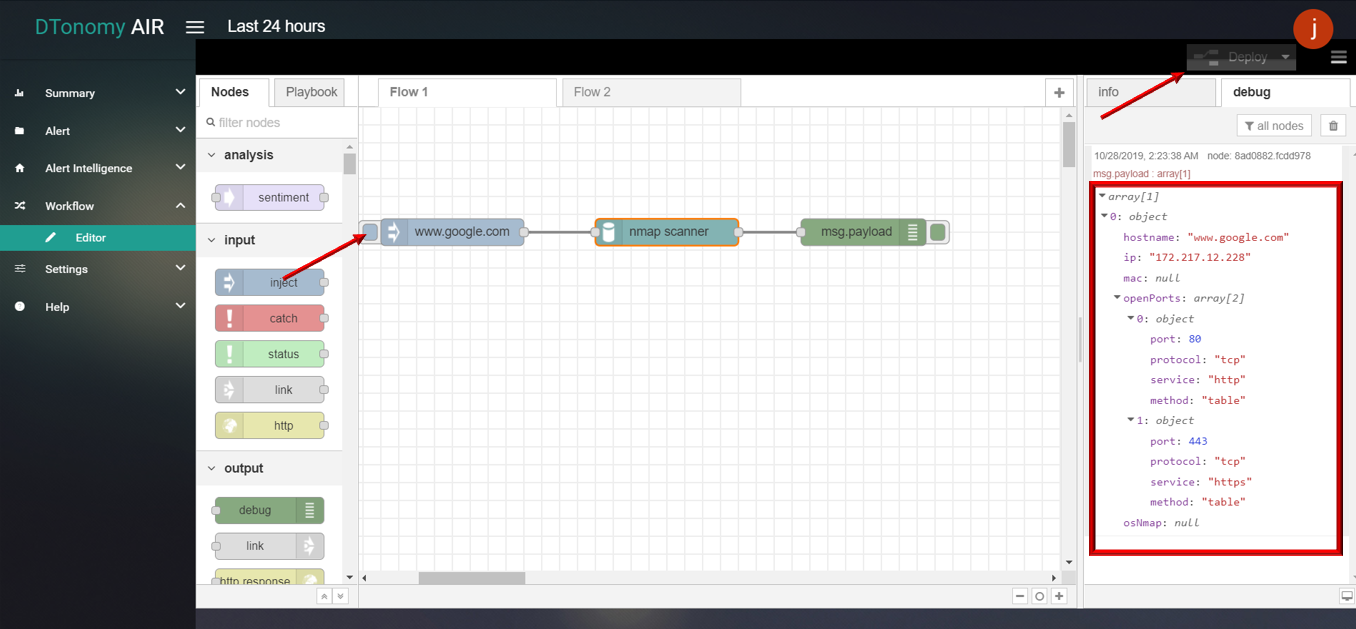
Nmap
This node supports query for ips, port, protocol, service, method information using domain name.
- Nmap
- Drag and drop NMAP node from palette under NETWORK , connect with INJECT node and DEBUG node.
- Double click INJECT node, set Payload to string and enter DNS (for example: www.google.com).
- Double click NMAP node, select Scan Type as “Nmap Scan” (You can also choose “Os and Port Scan” or “Quick Scan” based on requirement).
- Click Save button, then click INJECT button with DEBUG sidebar tab open, Scan result is shown in the debug window.
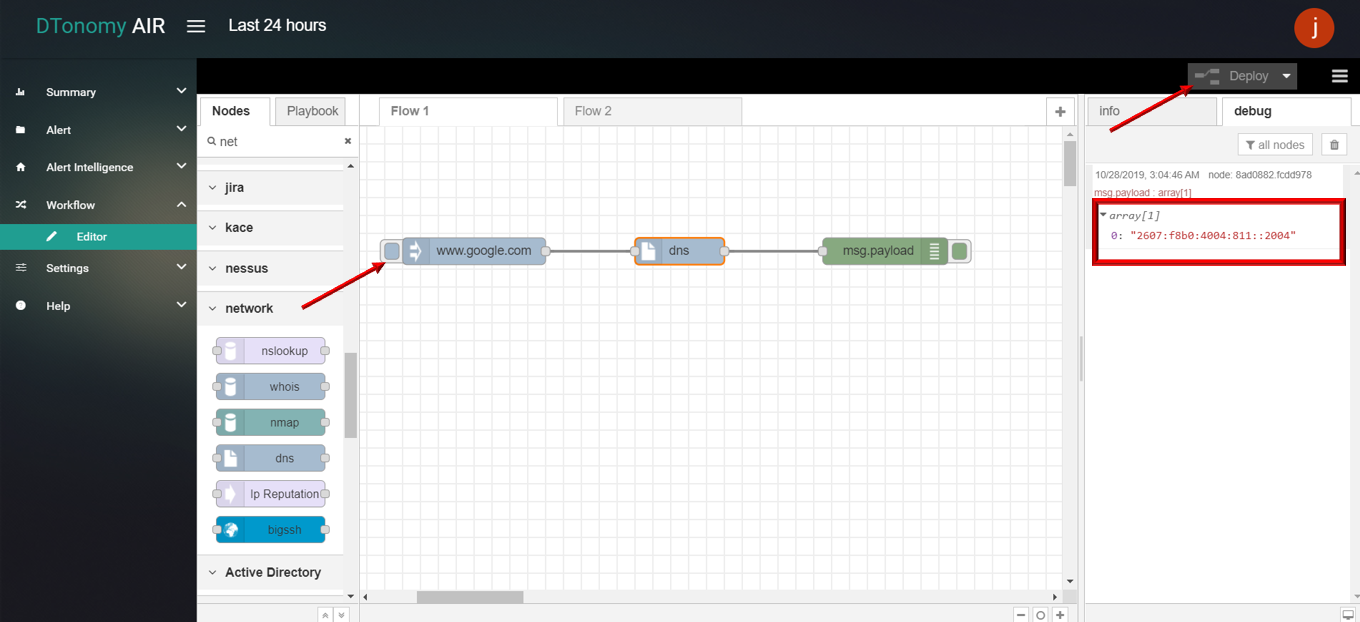
DNS
This node supports query for dns information using domain name.
- DNS
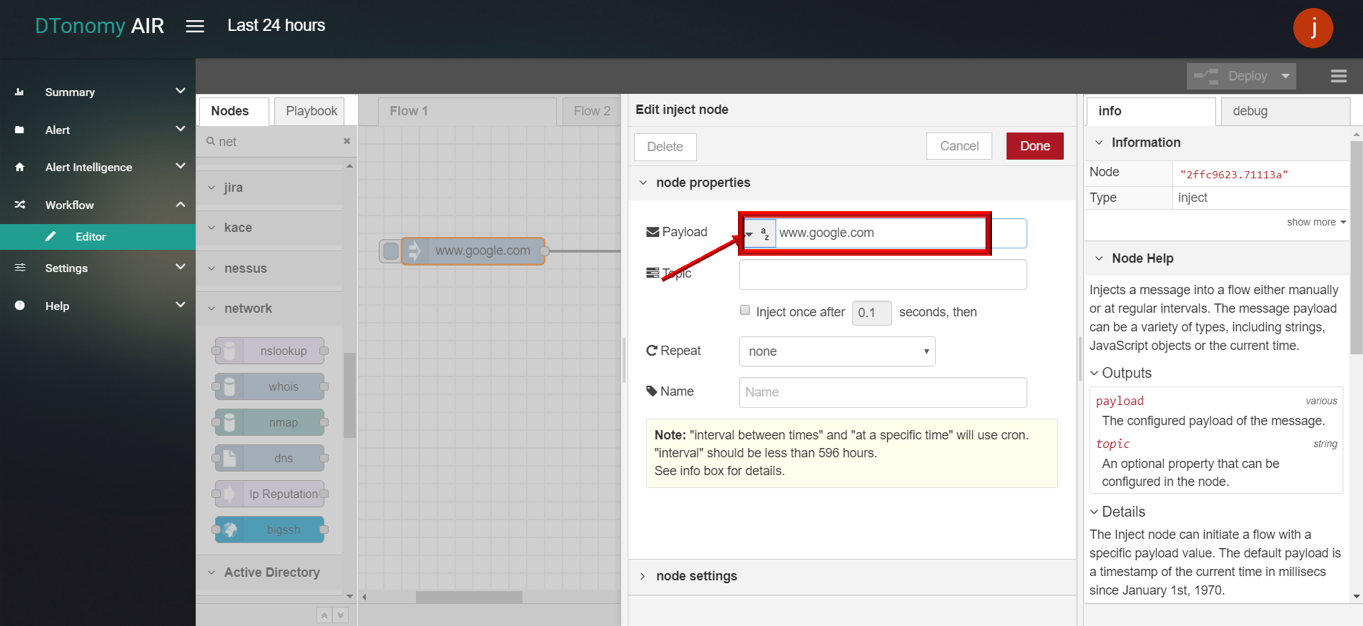
- Drag and drop DNS node from palette under NETWORK , connect with INJECT node and DEBUG node.
- Double click INJECT node, set Payload to string and enter DNS (for example: www.google.com).
- Double click NMAP node, select Method based on specific requirement (For detail method please read info panel).
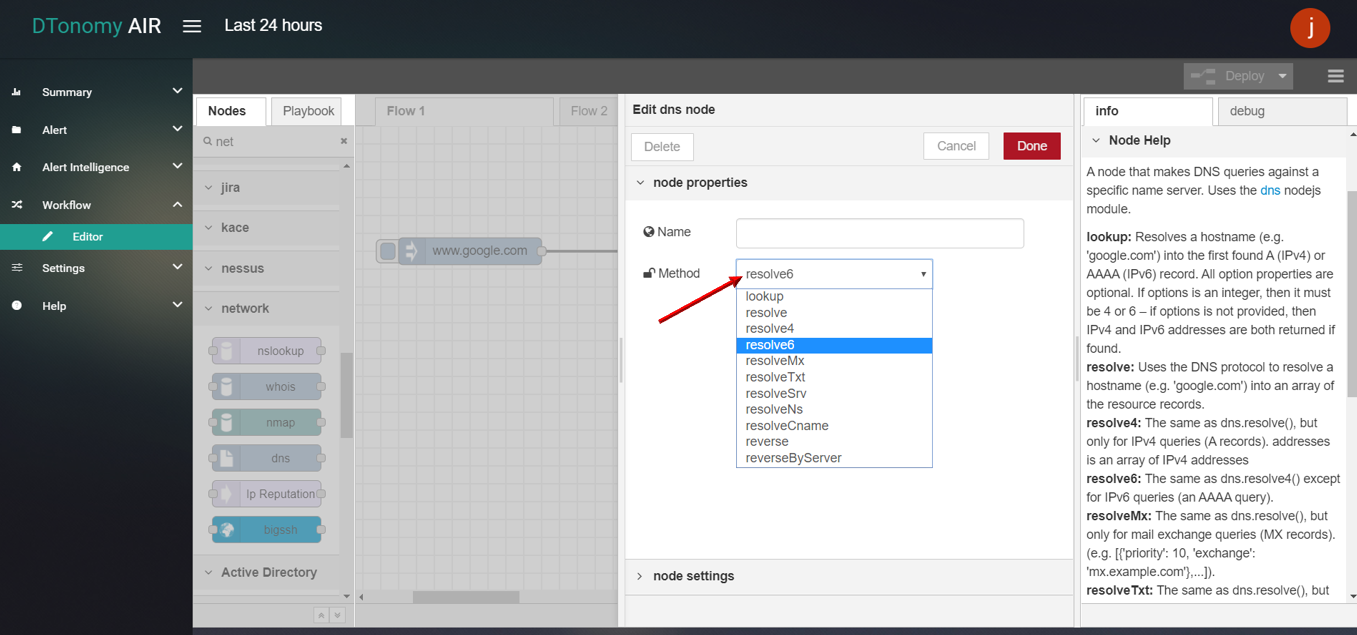
- Click Save button, then click INJECT button with DEBUG sidebar tab open, result is shown in the debug window.
ip reputation
This node supports query Minemeld with server address and parameters
ip geo
Get IP geolocation information.
bigssh
Launch a remote command using SSH.
Active Directory
Actions supported :
- find user
- find group
- query active directory
find user
Connects to a Microsoft Active Directory and returns the user corresponding to the username/DN set in msg.payload.
find group
Connects to a Microsoft Active Directory and returns the group corresponding to the group name/DN set in msg.payload.
query active directory
Connects to a Microsoft Active Directory and returns the result of the AD query input set in msg.payload.
Storage
We support actions interacting with database. Actions supported :
- sqldbs
- simple queue
sqldbs
This node allows basic access to a sqldbs database, allows both INSERTS and DELETES.
simple queue
Use this node to store incoming messages in the memory queue. Use feedback from the following action or message with trigger property to release the next message.
VISEO REST
Connector to Google Service and supports :
- Spreadsheet
Spreadsheet
Manipulate a Google spreadsheet with Sheets API.
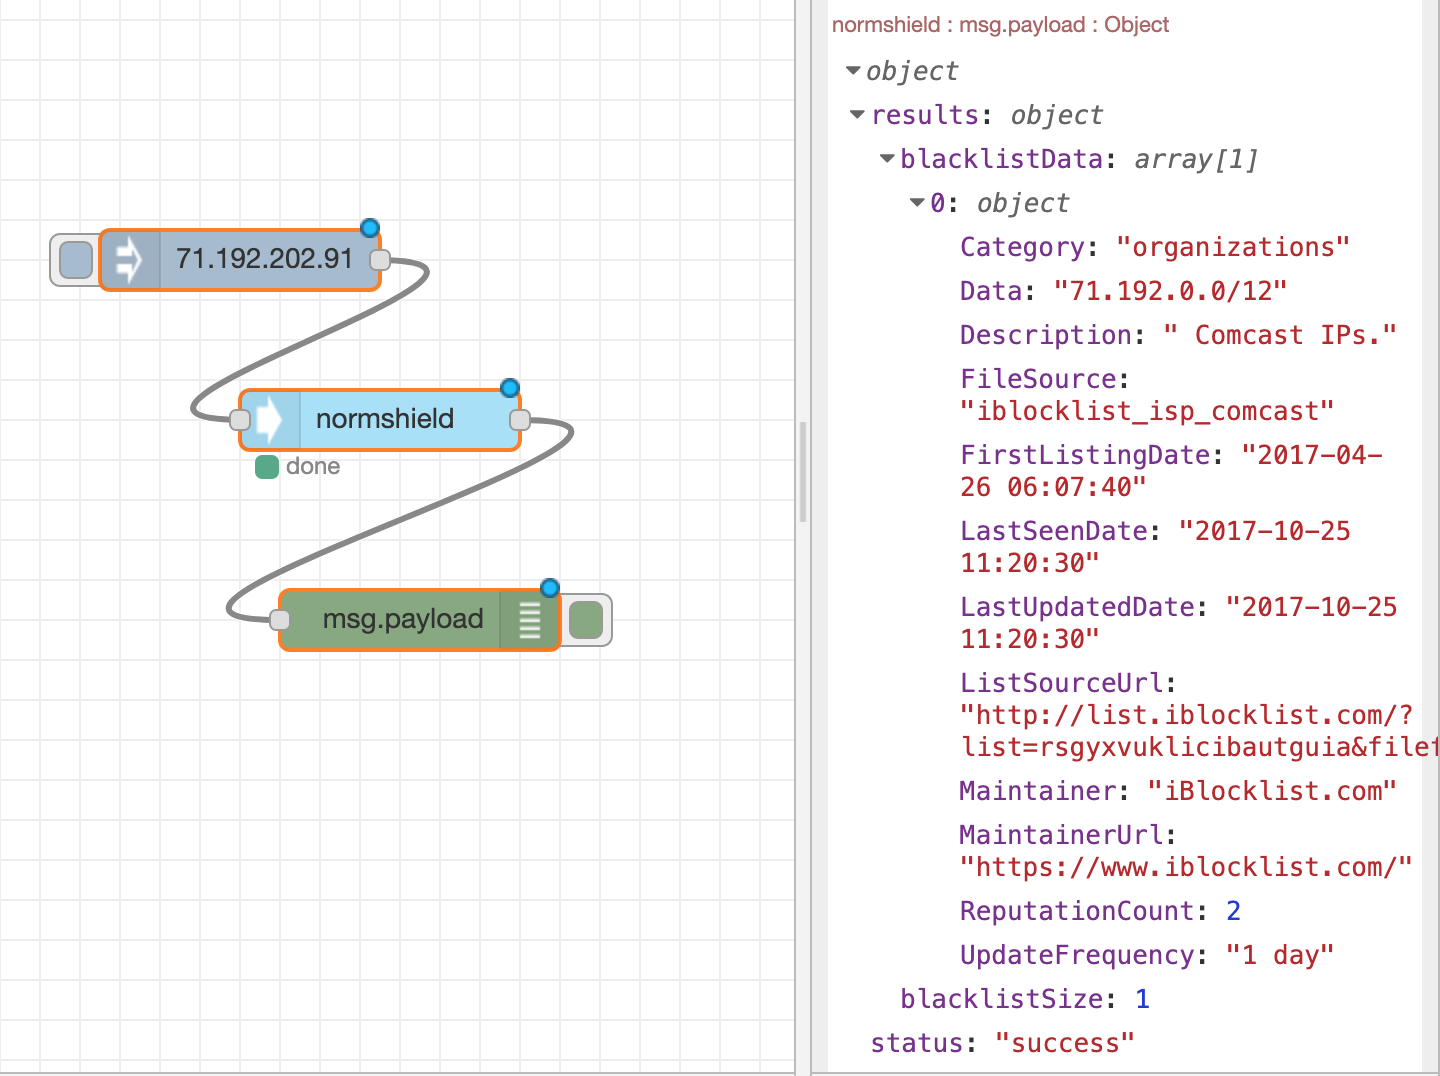
NormShield
Actions supported :
- NormShield
The NormShield Node lets users integrate with NormShield’s IP Blacklist search functionality: users can query IP to check to see if certain IP address is part of any blacklist. (Ref: https://services.normshield.com/blacklist)
- 1. Navigate to DTonomy Panel
1.1 Search and drag “normshield” from left panel to palette.
1.2 Configure IP address from previous node by default, you can also specify IP in current node.
1.3 Run workflow.
- 2. See Result
Office365
To perform any actions against Office365 API, you need to set up OAuth configuration by entering the authorization credentials that identify the application to Azure’s OAuth server. The following steps explain how to create credentials:
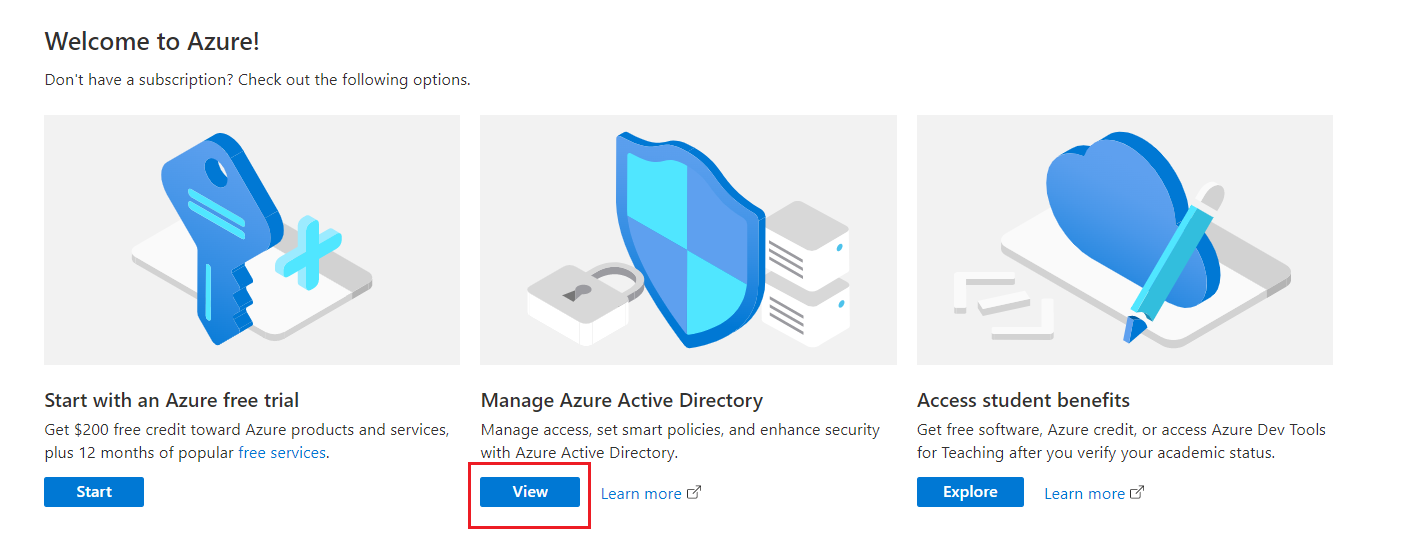
1. Log into the Azure Portal: https://portal.azure.com
- 2. Manage Azure Active Directory / View.
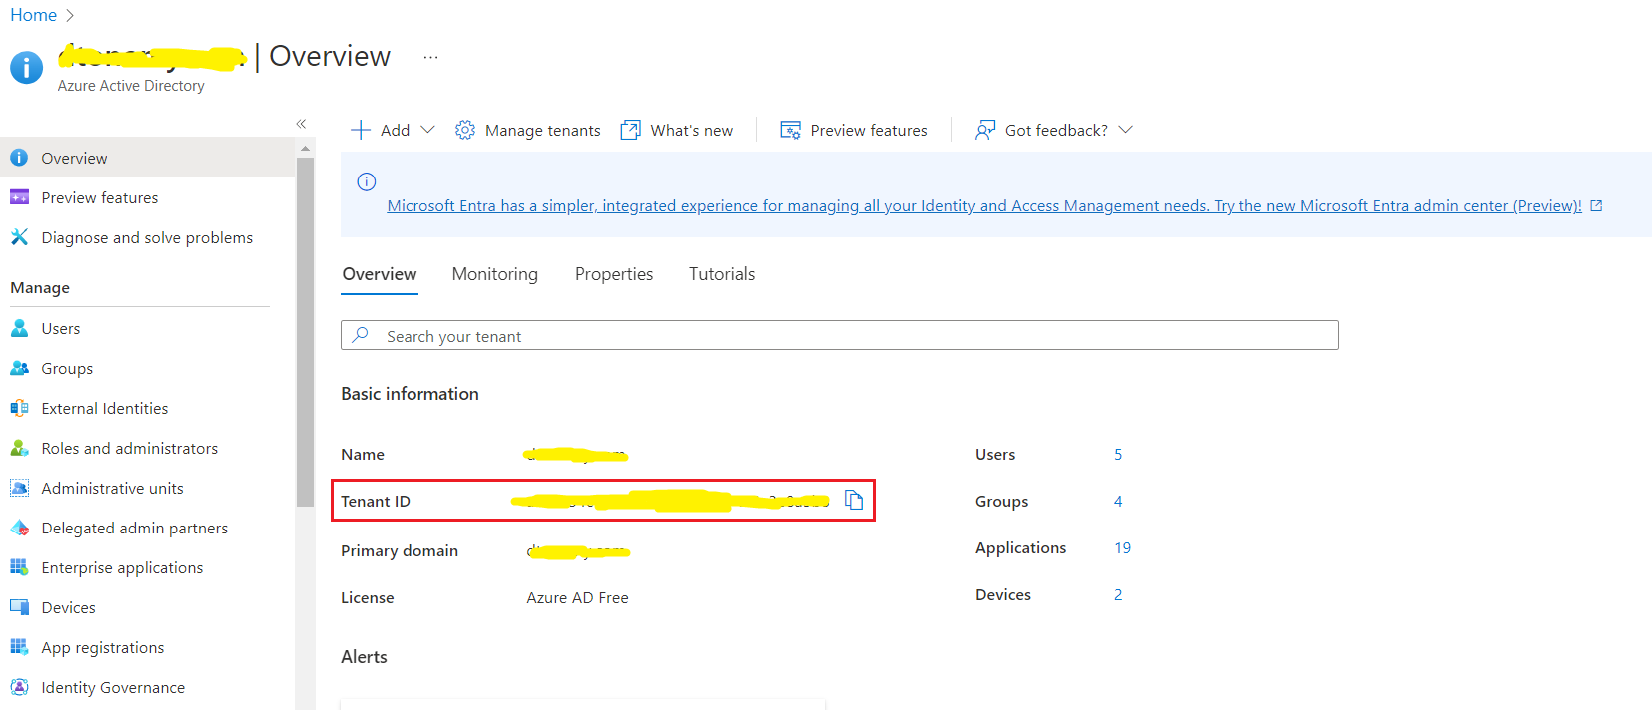
- 3. Record “Tenant ID” as the first required authorization credential
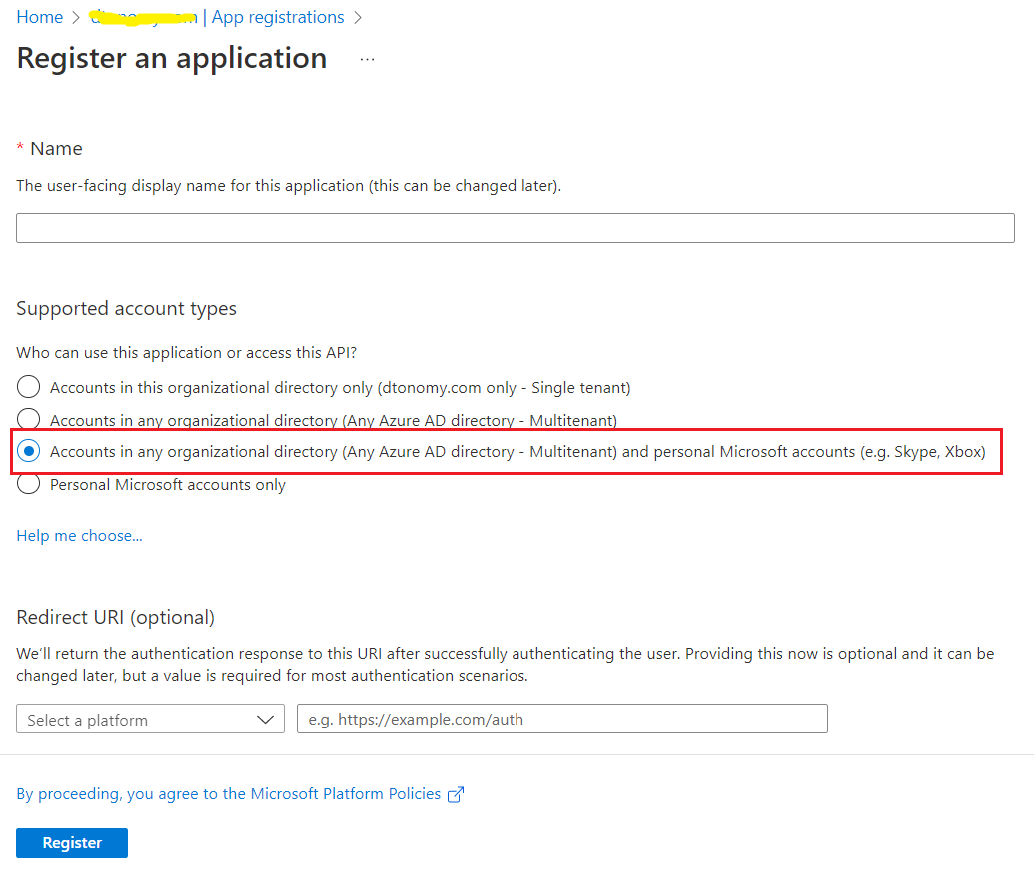
- 4. App registrations / New Registration.
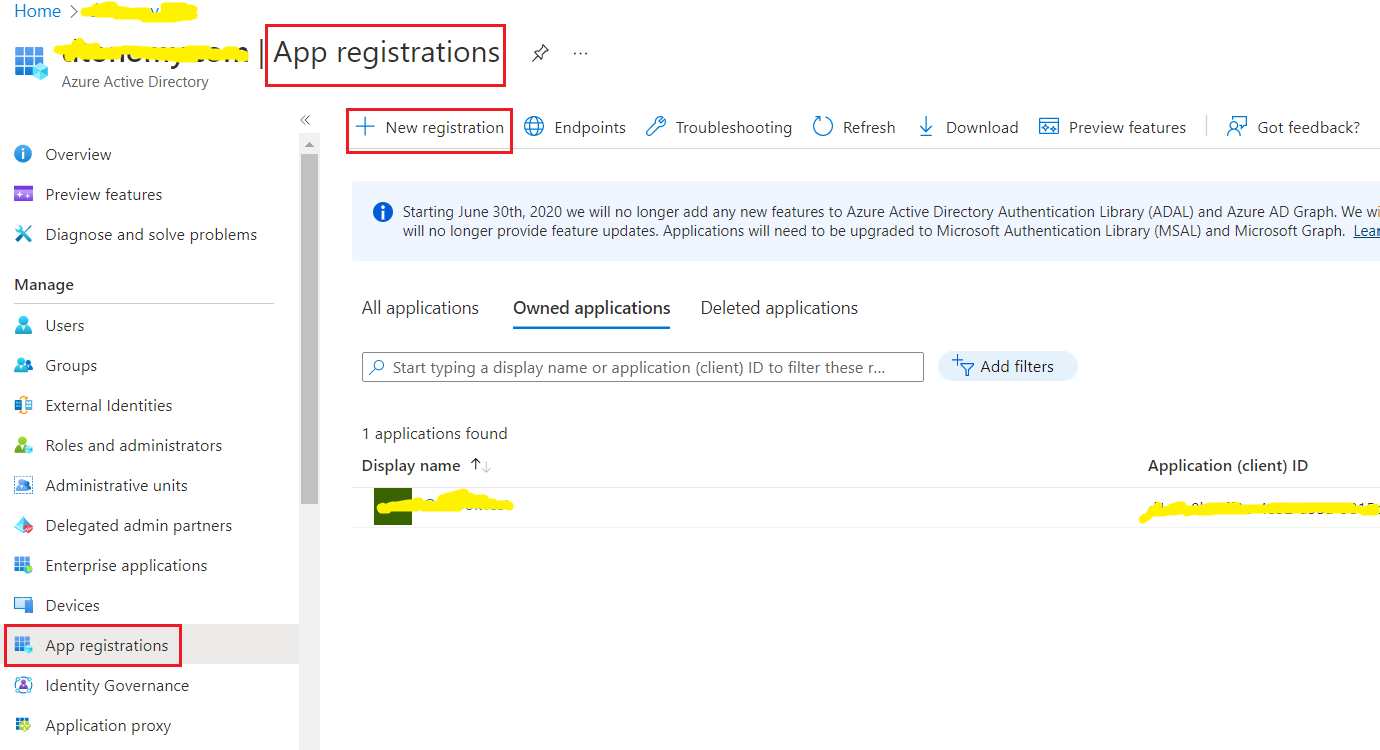
5. Set the name.
- 6. Set the supported account types to:”Accounts in any organizational directory (Any Azure AD directory - Multitenant) and personal Microsoft accounts (e.g. Skype, Xbox)”.
7. Set the redirect URI to https://dtonomy-api-base-url/workflow/azure-credentials/auth/callback
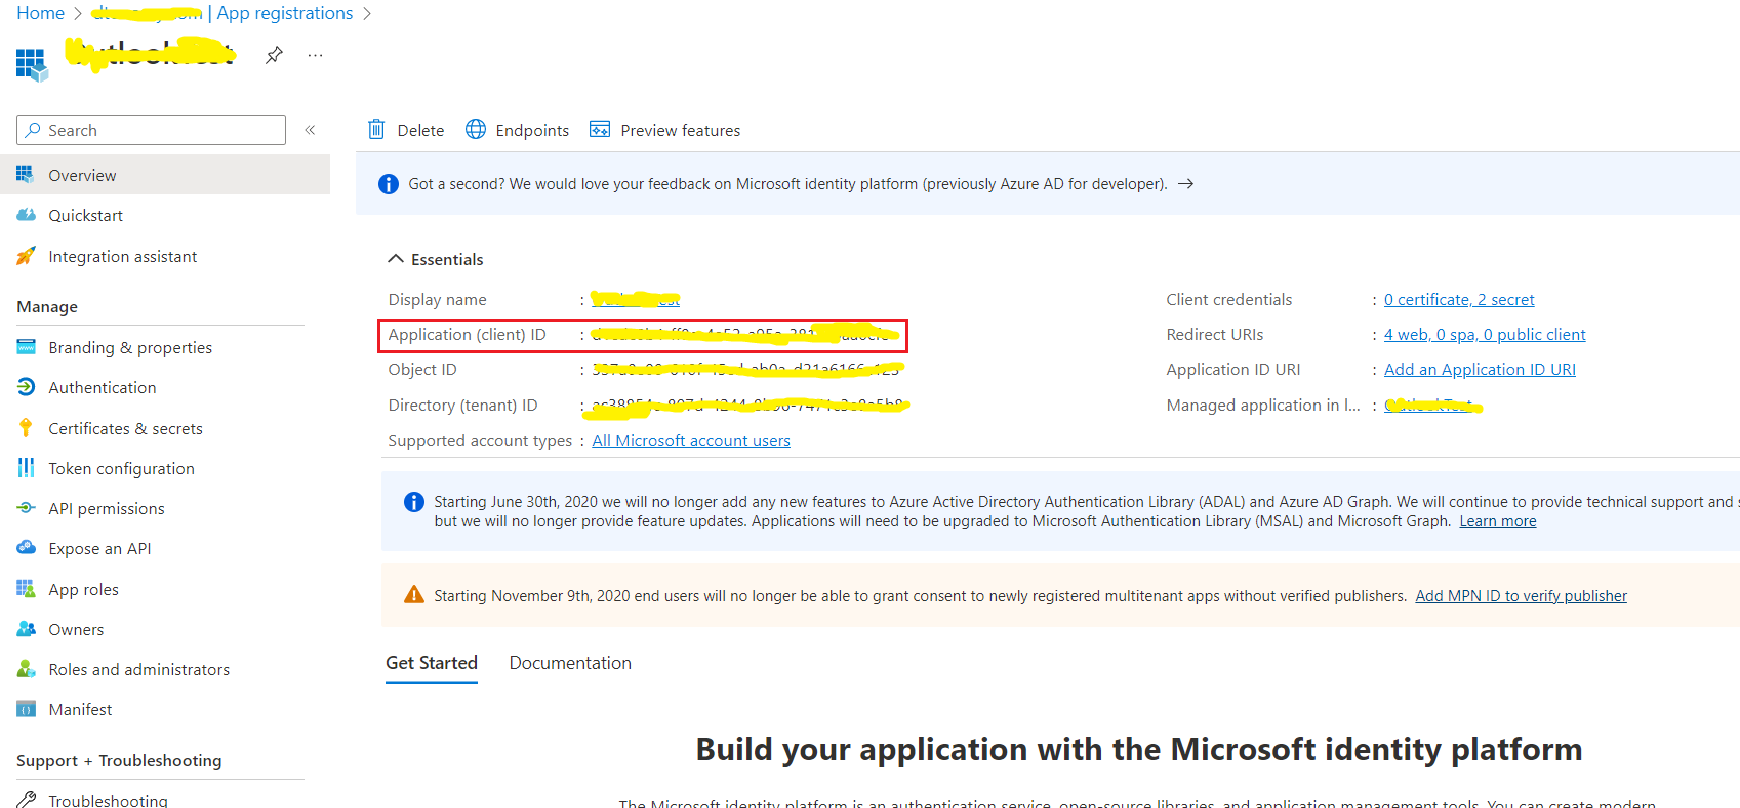
- 8. Now the App is registered, record the “Application(Client) ID” as the second required authorization credential
- 9. Create a secret: Certificates and secrets / New Client Secret
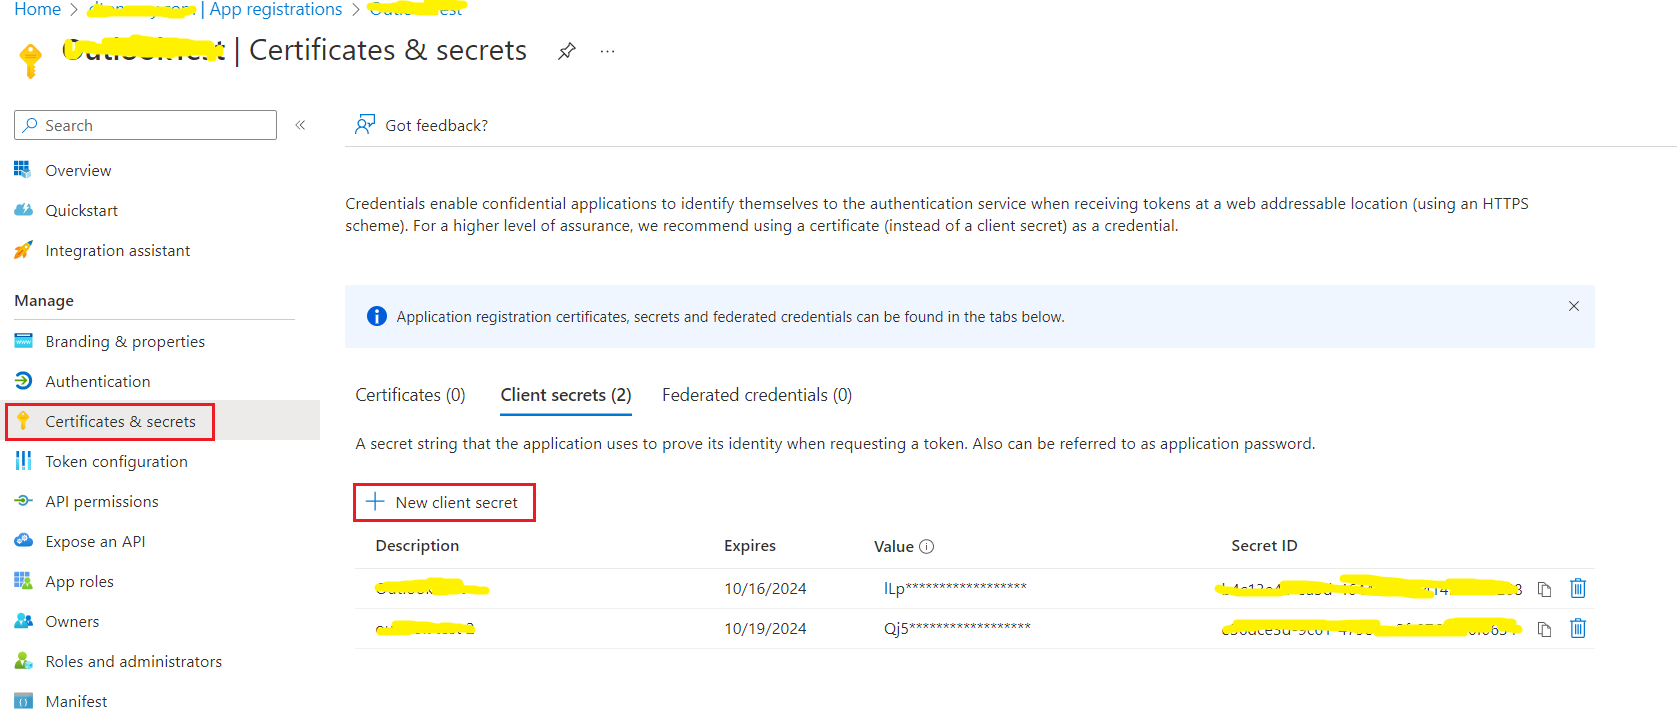
10. Please note the secret value will only be displayed when created, so record the “Client Secret” value as the third required authorization credential
11. Set up permissions: API permissions / Add a permission / Microsoft Graph / Delegated permissions / add “openid”, “offline_access”, “IMAP.AccessAsUser.All” and “SMTP.Send” .. image:: /picture/automation/azure-oauth-step11.png
width: 600pt
Once you have the three authorization credentials, Tenant ID, Client ID, Client Secret, from above steps, you can enter them in the node’s “Add new azure-credentials…” field. .. image:: /picture/automation/azure-oauth-config.png
width: 600pt
Then click on “Start Authentication” button and complete the MFA authentication process. At the end you should see a web page pop up displaying “Authorized” to indicate the success of completing the OAuth configuration.
Actions supported :
- get outlook email
- send outlook email
- delete outlook email
- query mail by sender
get Outlook email
This node will get emails from an Outlook account.
send Outlook email
This node will send an email from an Outlook account.
delete Outlook email
This node will delete an email with the configured subject for the email.
query mail by sender
This node will query emails with target sender in a Office 365 Mailbox.
OTX
Actions supported :
- is malicious
is malicious
Use OTX to determine if files, domains, IPs or URLs are malicious.
PDF
Actions supported :
- checkEncryptionPdf
- decryptPdf
checkEncryptionPdf
Check if pdf is encrypted or not.
decryptPdf
Decrypt pdf using password.
Phishing Email
Actions supported :
- extractUrl
- extractIp
- extractDomain
- extractEmail
- calculateHash
- parseEml
- delete Outlook email
- delete Gmail email
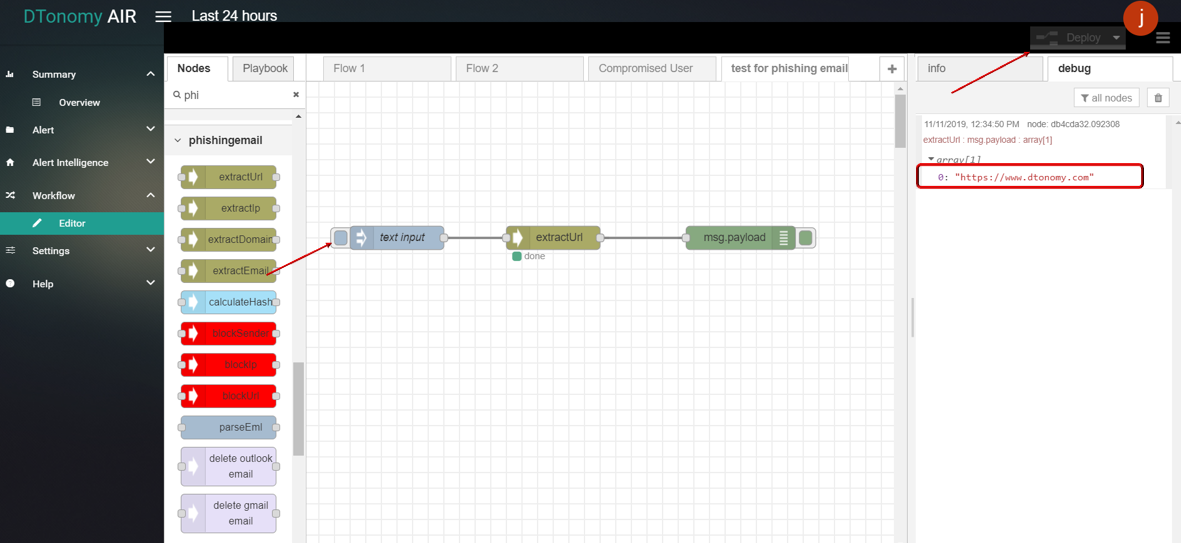
extractUrl
This node supports extract URLs from text (string) input.
- extractUrl
- Drag and drop EXTRACT URL node from palette under PHISHING EMAIL , connect with INJECT node and DEBUG node.
- Double click INJECT node, set Payload to string and enter some text content.
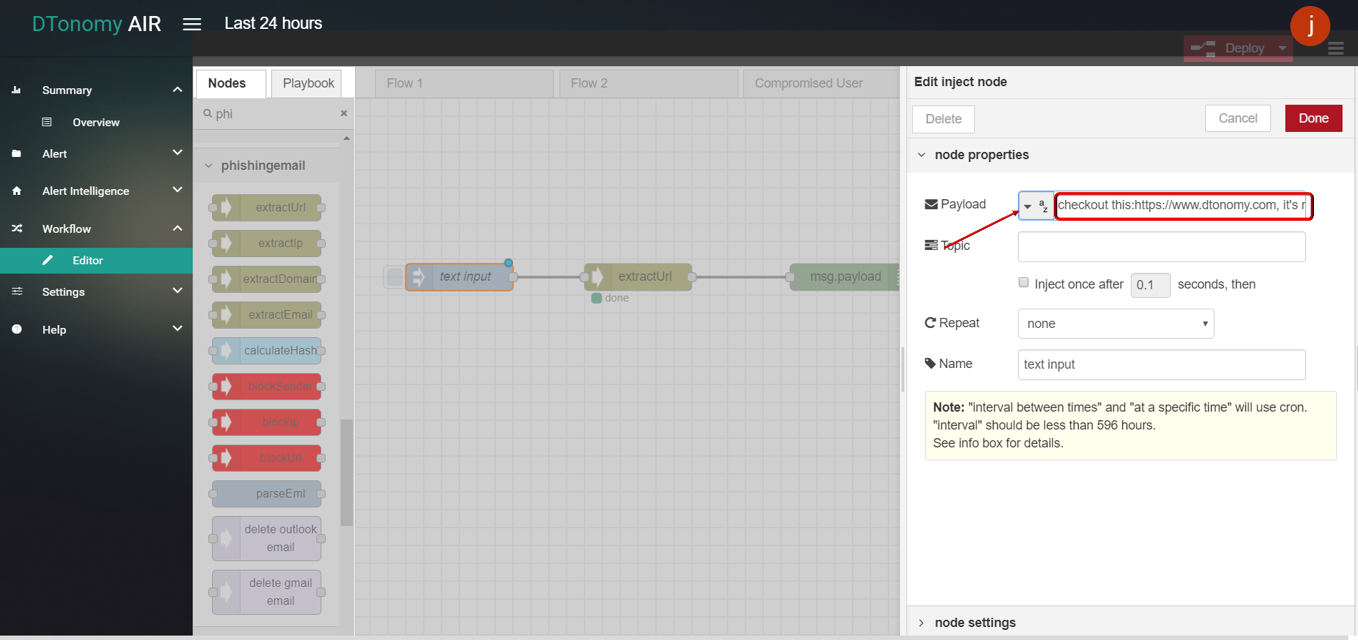
- Click Save button, then click INJECT button with DEBUG sidebar tab open, urls inside text are shown in the debug window.
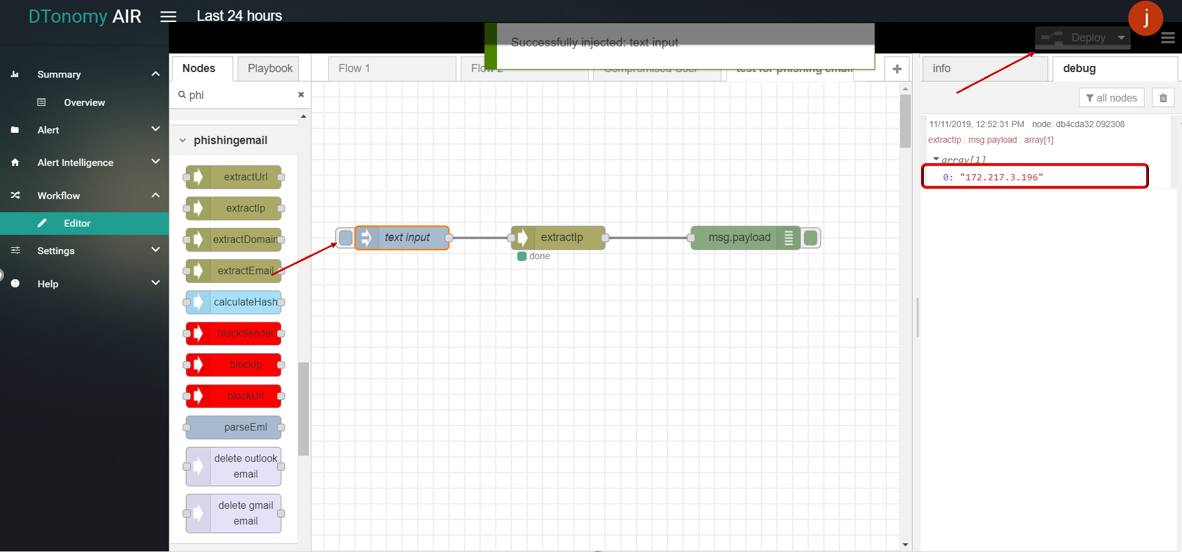
extractIp
This node supports extract IPs from text (string) input.
- extractIp
- Drag and drop EXTRACT IP node from palette under PHISHING EMAIL , connect with INJECT node and DEBUG node.
- Double click INJECT node, set Payload to string and enter some text content.
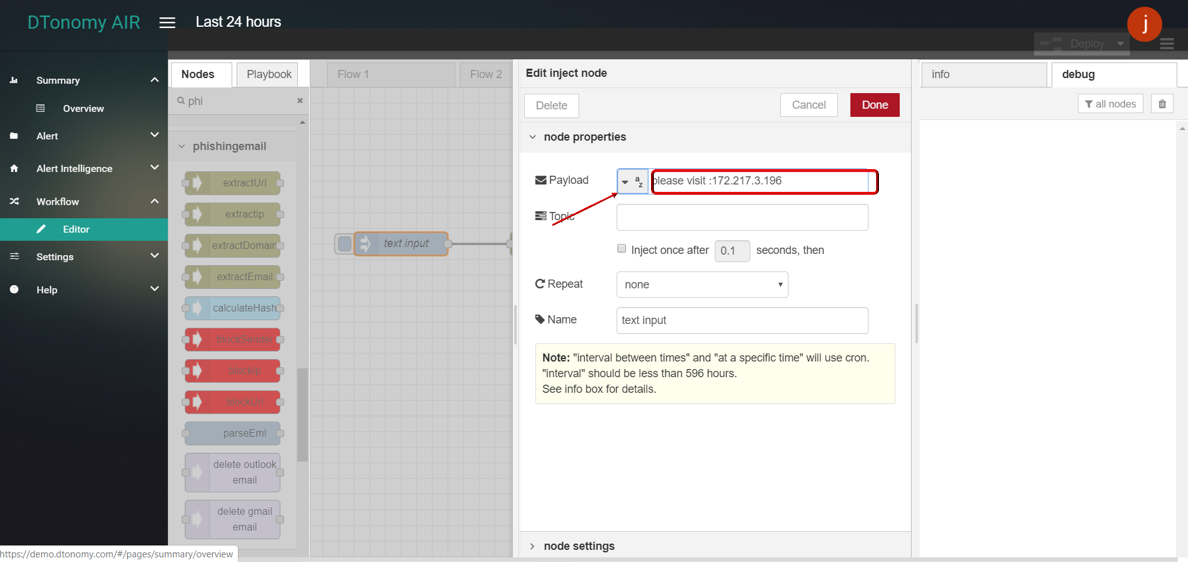
- Click Save button, then click INJECT button with DEBUG sidebar tab open, IPs inside text are shown in the debug window.
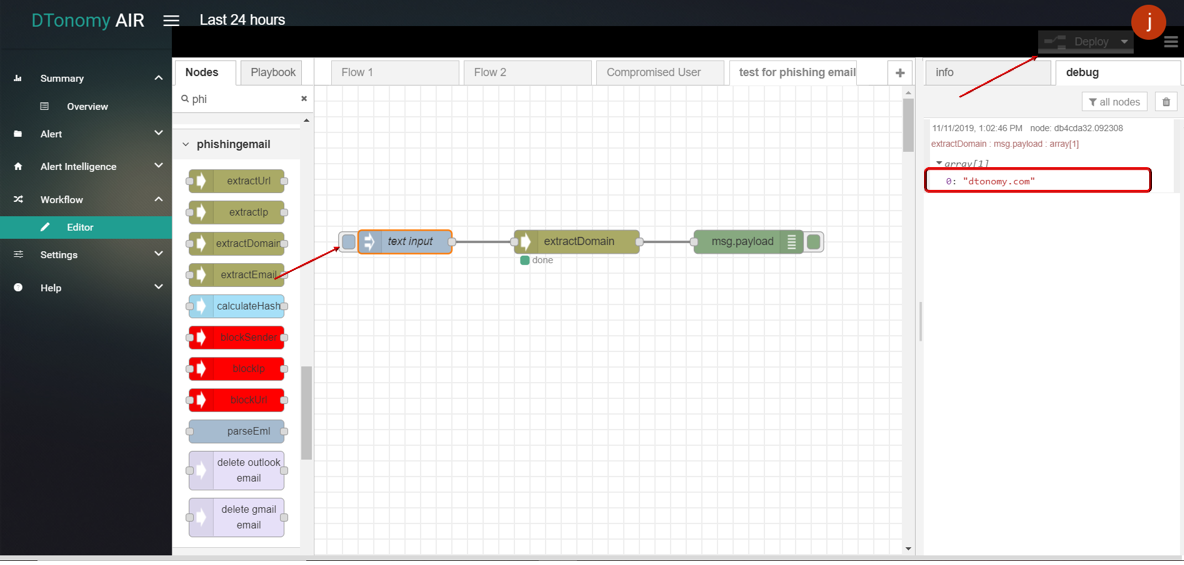
extractDomain
This node supports extract IPs from text (string) input.
- extractDomain
- Drag and drop EXTRACT DOMAIN node from palette under PHISHING EMAIL , connect with INJECT node and DEBUG node.
- Double click INJECT node, set Payload to string and enter some text content.
- Click Save button, then click INJECT button with DEBUG sidebar tab open, domains inside text are shown in the debug window.
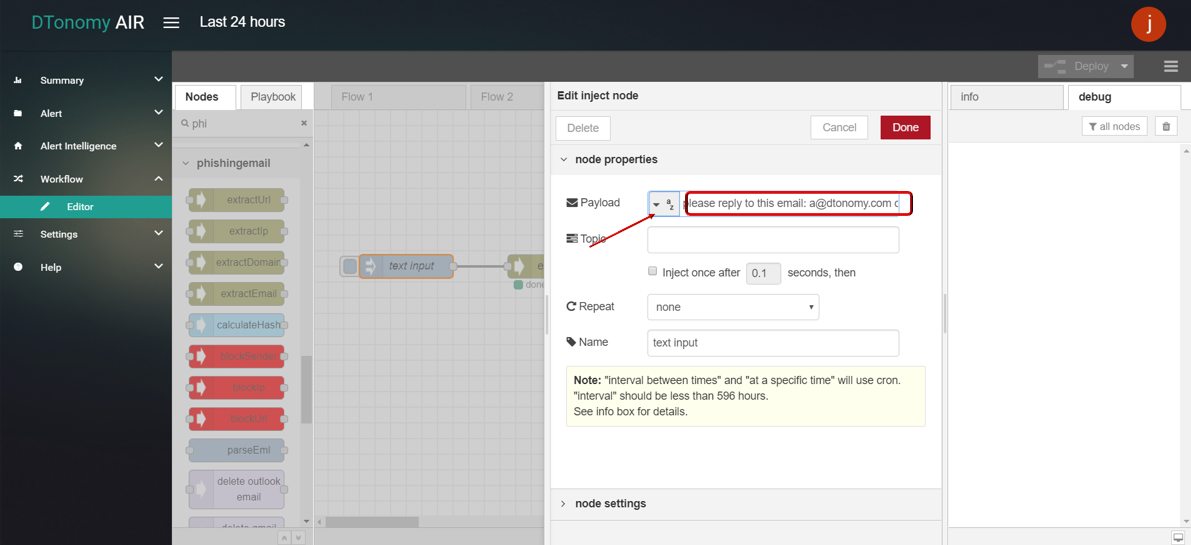
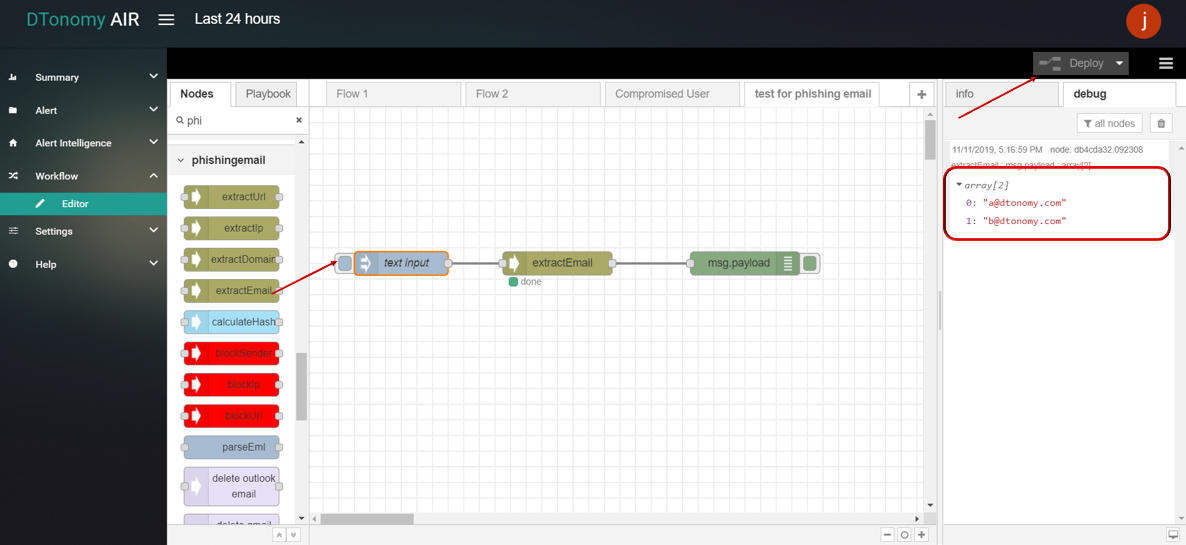
extractEmail
This node supports extracting Email address from text (string) input.
- extractEmail
- Drag and drop EXTRACT EMAIL node from palette under PHISHING EMAIL , connect with INJECT node and DEBUG node.
- Double click INJECT node, set Payload to string and enter some text content.
- Click Save button, then click INJECT button with DEBUG sidebar tab open, emails inside text are shown in the debug window.
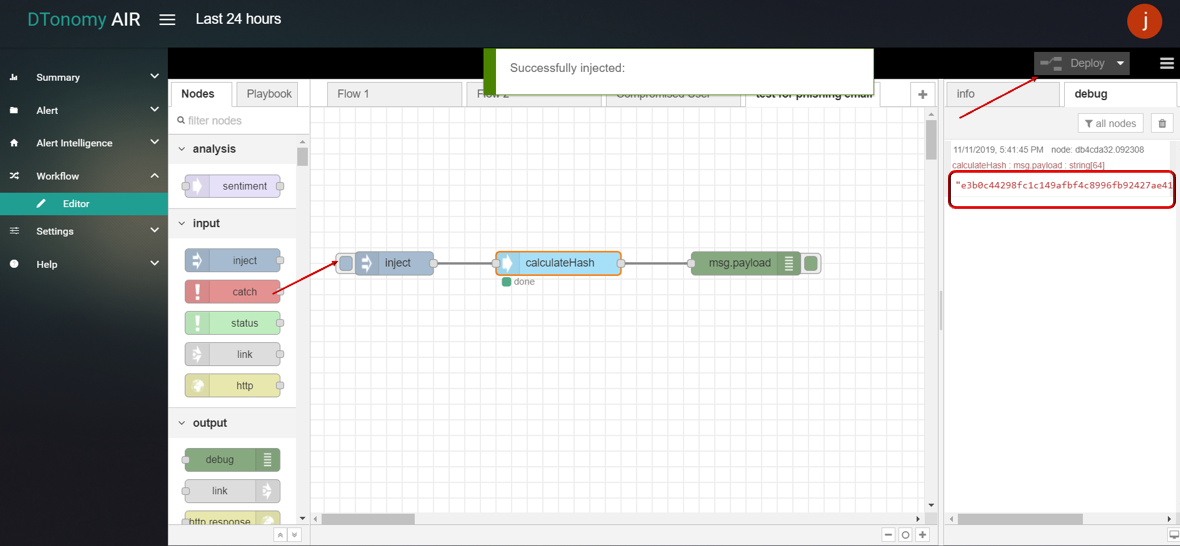
calculateHash
This node supports encoding string into hash value.
- calculateHash
- Drag and drop CALCULATE HASH node from palette under PHISHING EMAIL , connect with INJECT node and DEBUG node.
- Double click CALCULATE HASH node, enter some text content need to encode.
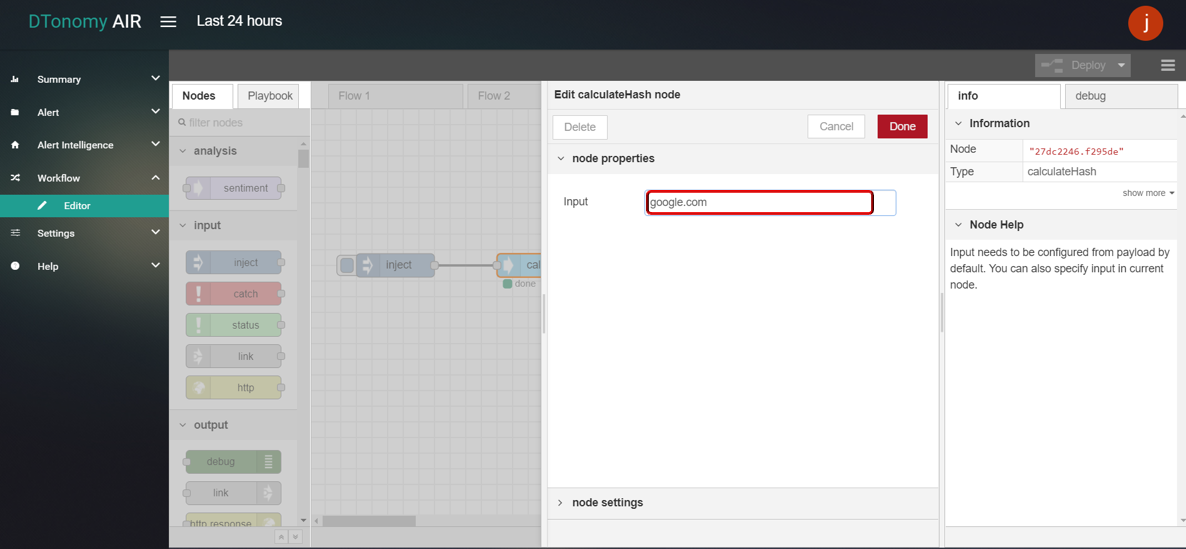
- Click Save button, then click INJECT button with DEBUG sidebar tab open, encoded hash value is shown in the debug window.
parseEml
Parse Eml file content to a dictionary object.
delete Outlook email
Delete an Email from Outlook.
delete Gmail email
Delete an Email from Gmail.
Proofpoint
Actions supported :
- Proofpoint
- ppdecode
Proofpoint
Search TAP events in proofpoint.
ppdecode
ProofPoint URL Decoder.
Rapid7 AppSpider
Actions supported :
- AppSpider scan
- AppSpider getVulns
AppSpider scan
Trigger scan actions in appspider.
AppSpider getVulns
Get vulnerabilities for a target host machine.
Rapid7 Nexpose
We support different actions for rapid7 nexpose : * Nexpose scan * Nexpose assetsList * Nexpose asset group * Nexpose asset * Nexpose remediation solution * Nexpose asset vulnerability * Nexpose ip vulnerability
Nexpose scan
Start a scan in Nexpose.
Nexpose assetsList
Query assets list from Rapid7 Nexpose.
Nexpose asset group
Query asset group in Nexpose.
Nexpose asset
Query/Add/Delete an asset in Nexpose.
Nexpose remediation solution
Get remediation solution for particular vulnerability of particular asset.
Nexpose asset vulnerability
Get asset vulnerability from Rapid7 Nexpose by asset id.
Nexpose ip vulnerability
Get vulnerabilities and solutions from Rapid7 Nexpose for particular ip.
Regular Expression
Actions supported :
- regularexpression
regularexpression
Write regular expression to extract text.
Remedy
Actions supported :
- remedyCreate
remedyCreate
Query Remedy specifying server address and credentials.
SCCM
Actions supported :
- get sms r system
- query sccm
get sms r system
Get SMS_R_System in SCCM Server.
query sccm
Run WMI command in SCCM Server.
Sentry
Actions supported :
- retrieve an issue
retrieve an issue
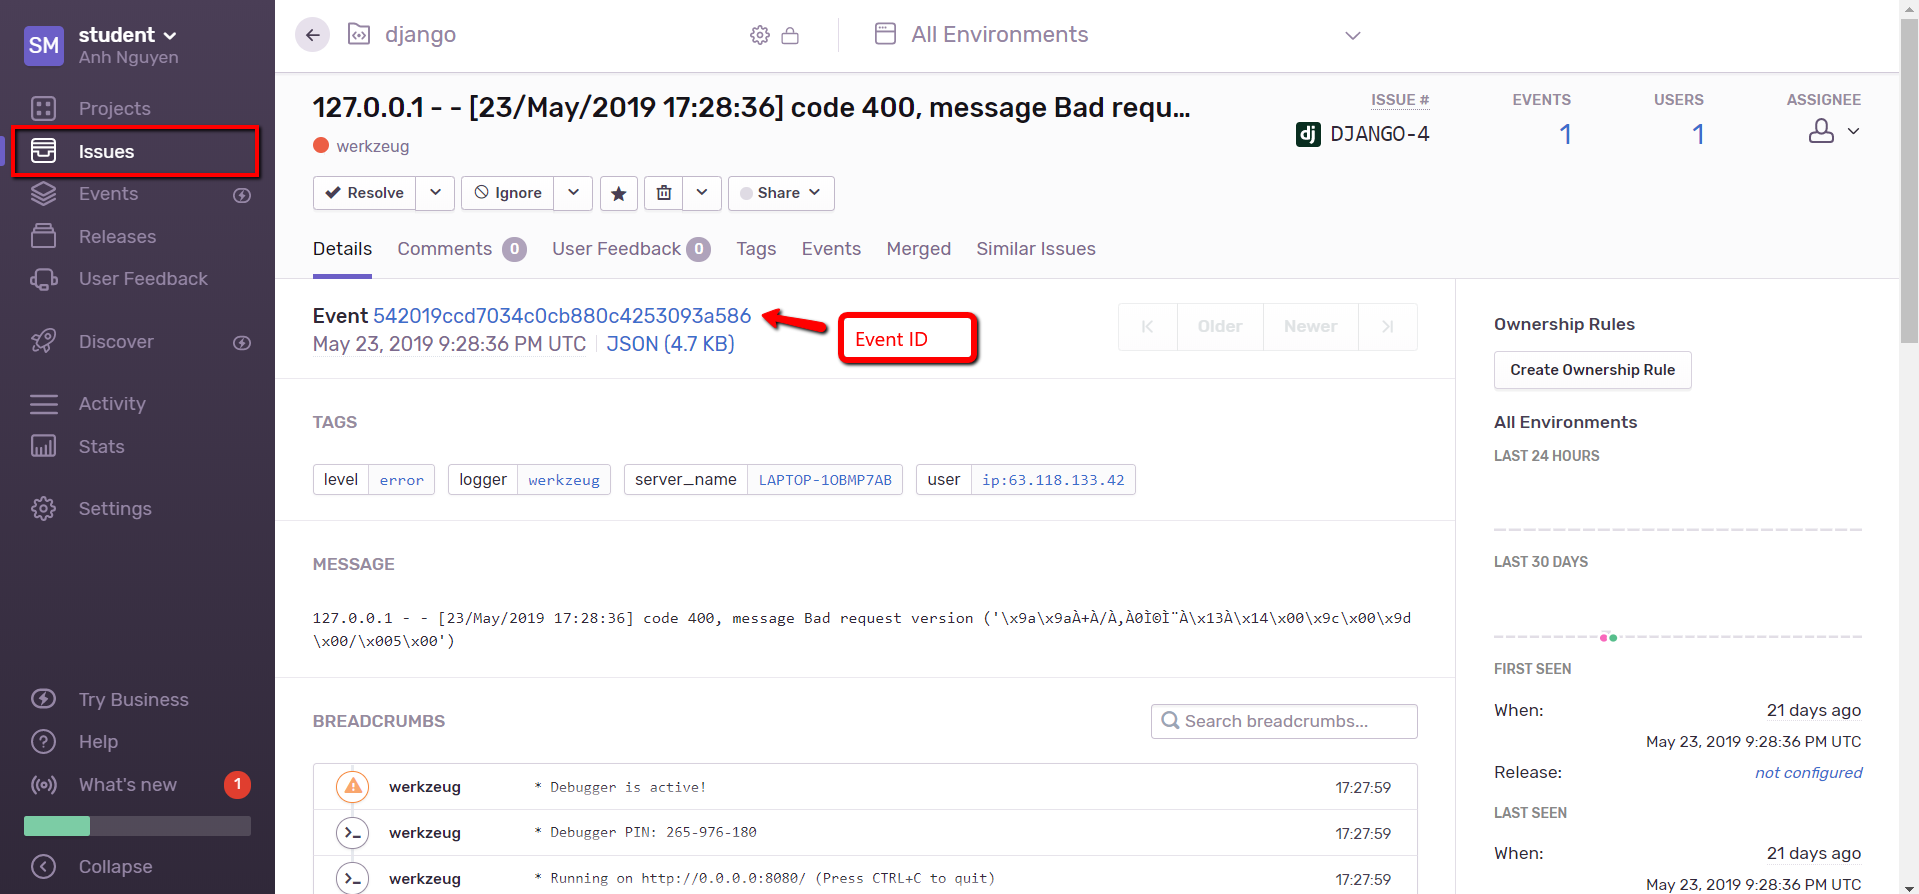
This node allows you to retrieve alerts from the sentry platform.
- 1. Log in/Sign up your Sentry account
- Simply log into your created account https://sentry.io/
- On the left menu, go to Issues to see a list of issues can be retrieved using the Sentry node, you can filter the results by selecting project, environment, or time range
- Select one issue of your choice to view the detail, the event id will be used to configure Sentry node in step 3
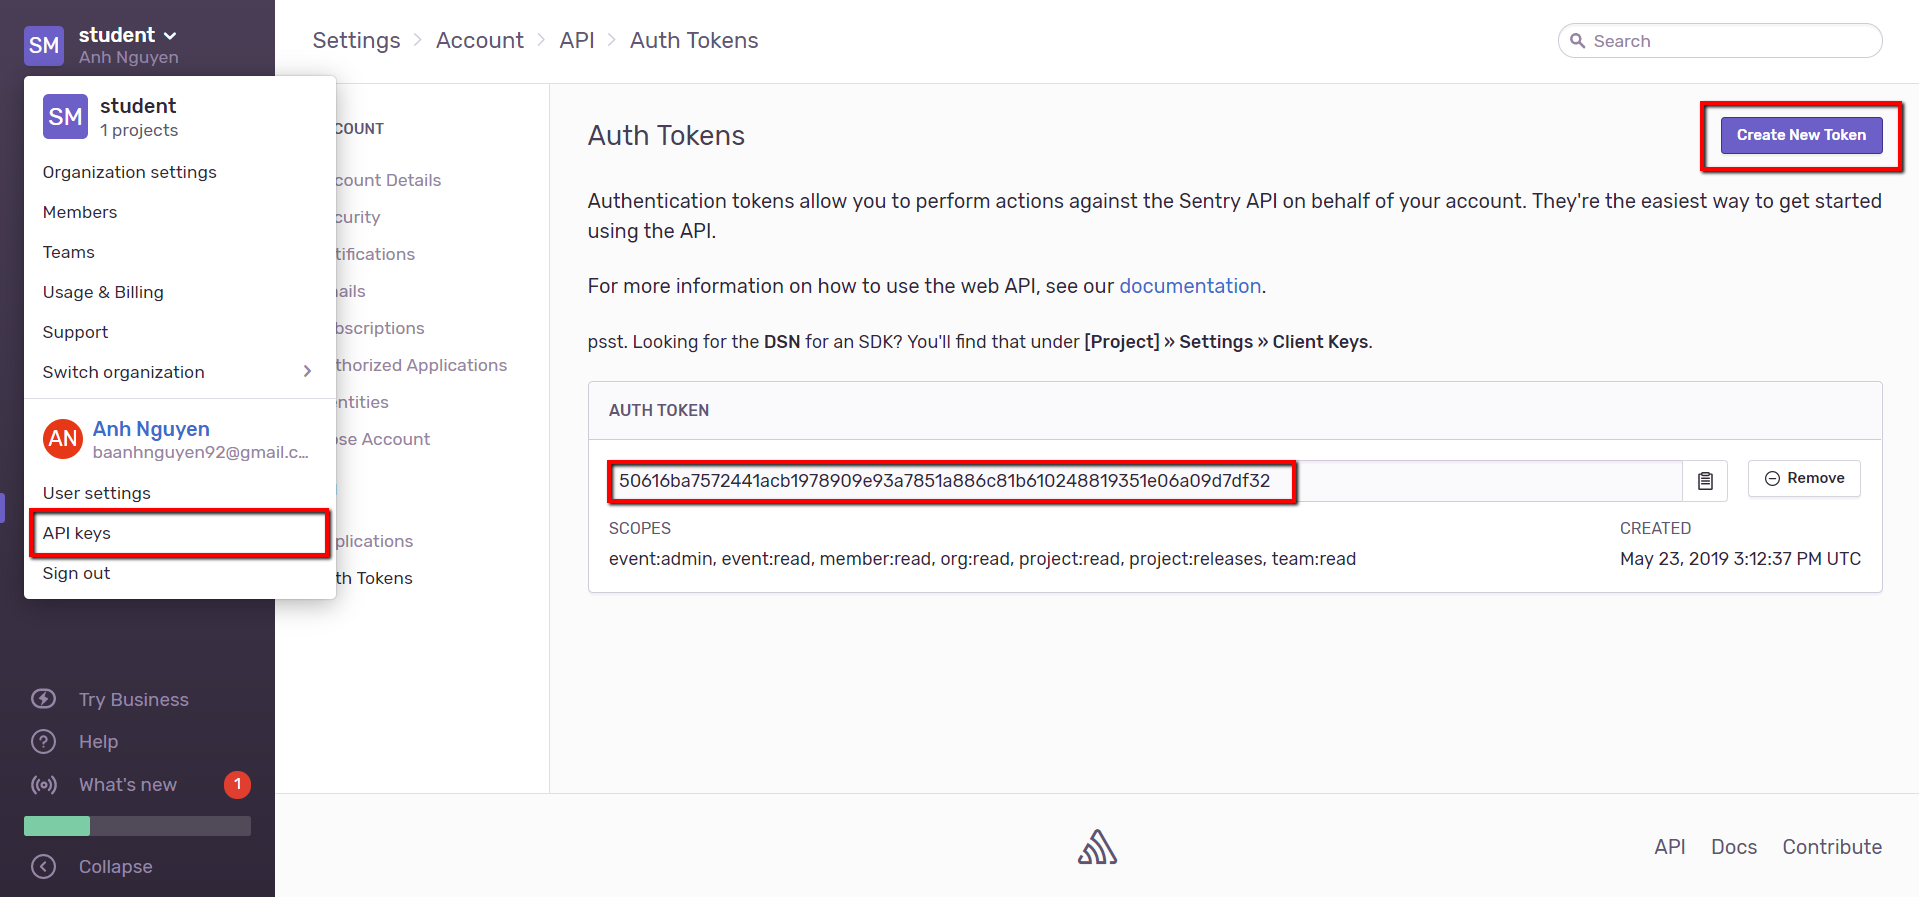
- 2. Create token
- Click on the username at the top left of your screen to view the menu and then select API Keys
- Select Create New Token to create new token
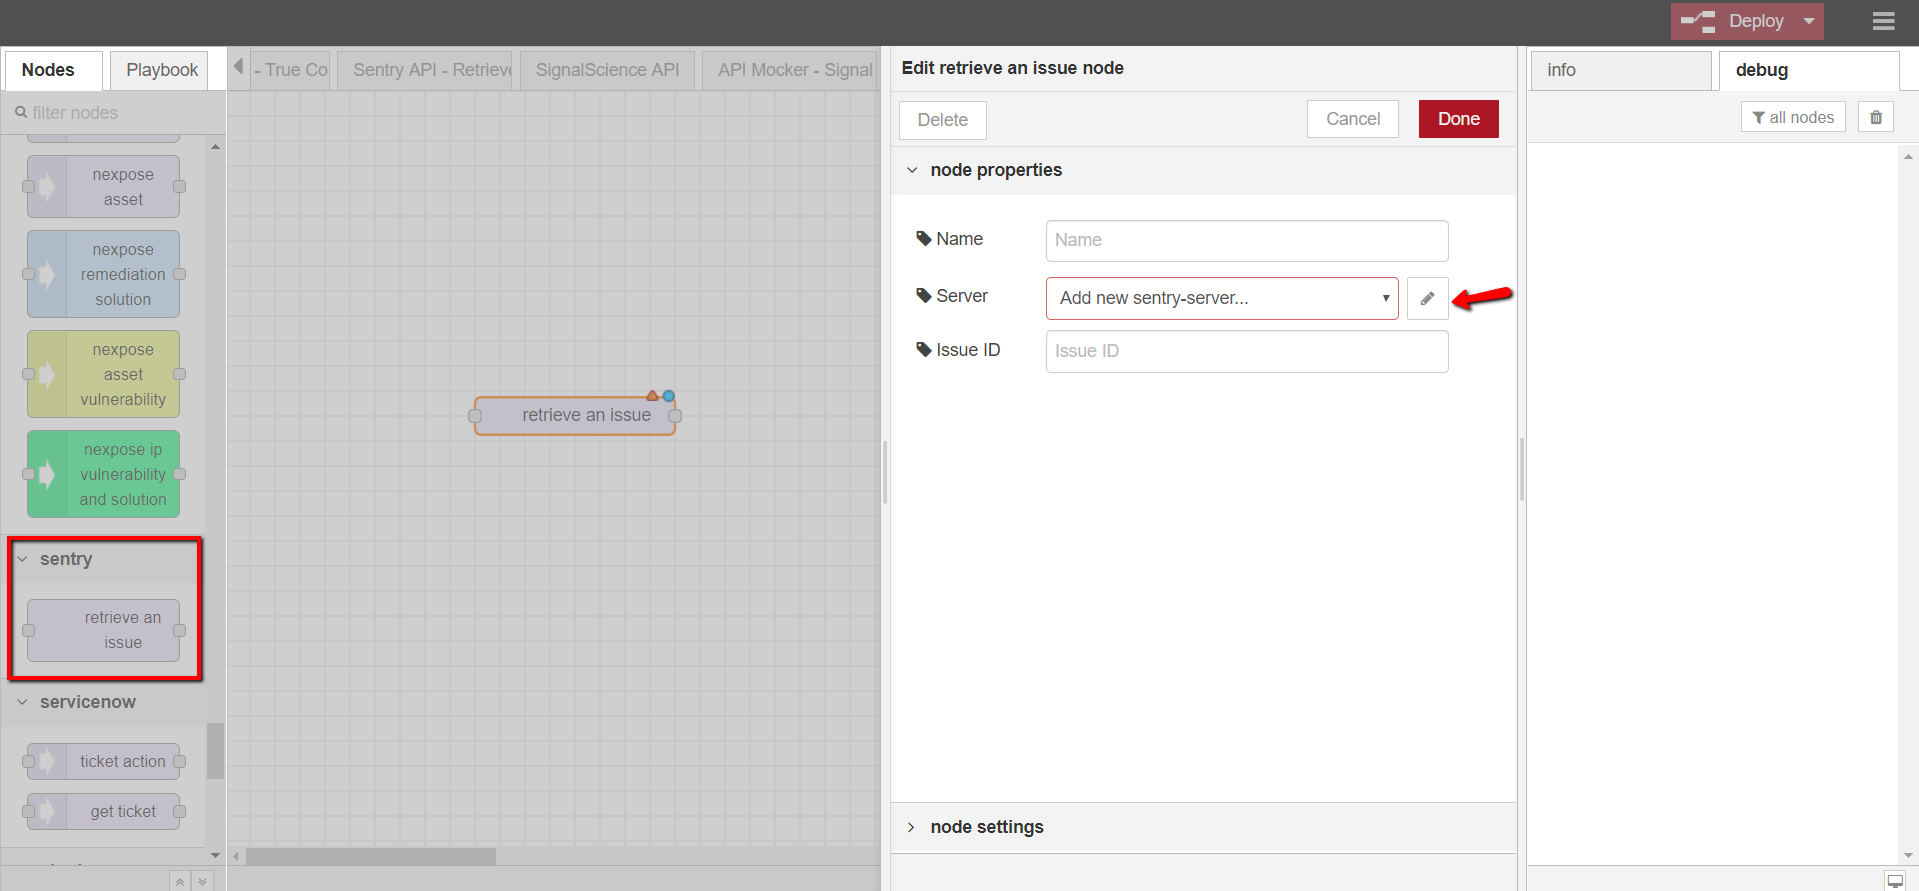
- 3. Configure the Sentry node
- Open DTonomy Workflow, drag and drop Sentry -> RETRIEVE AN ISSUE node to the workspace
- Double-click on the node to configure it
- Provide node name (optional), server info (use the Token from step 2), and event ID (optional) from step 2
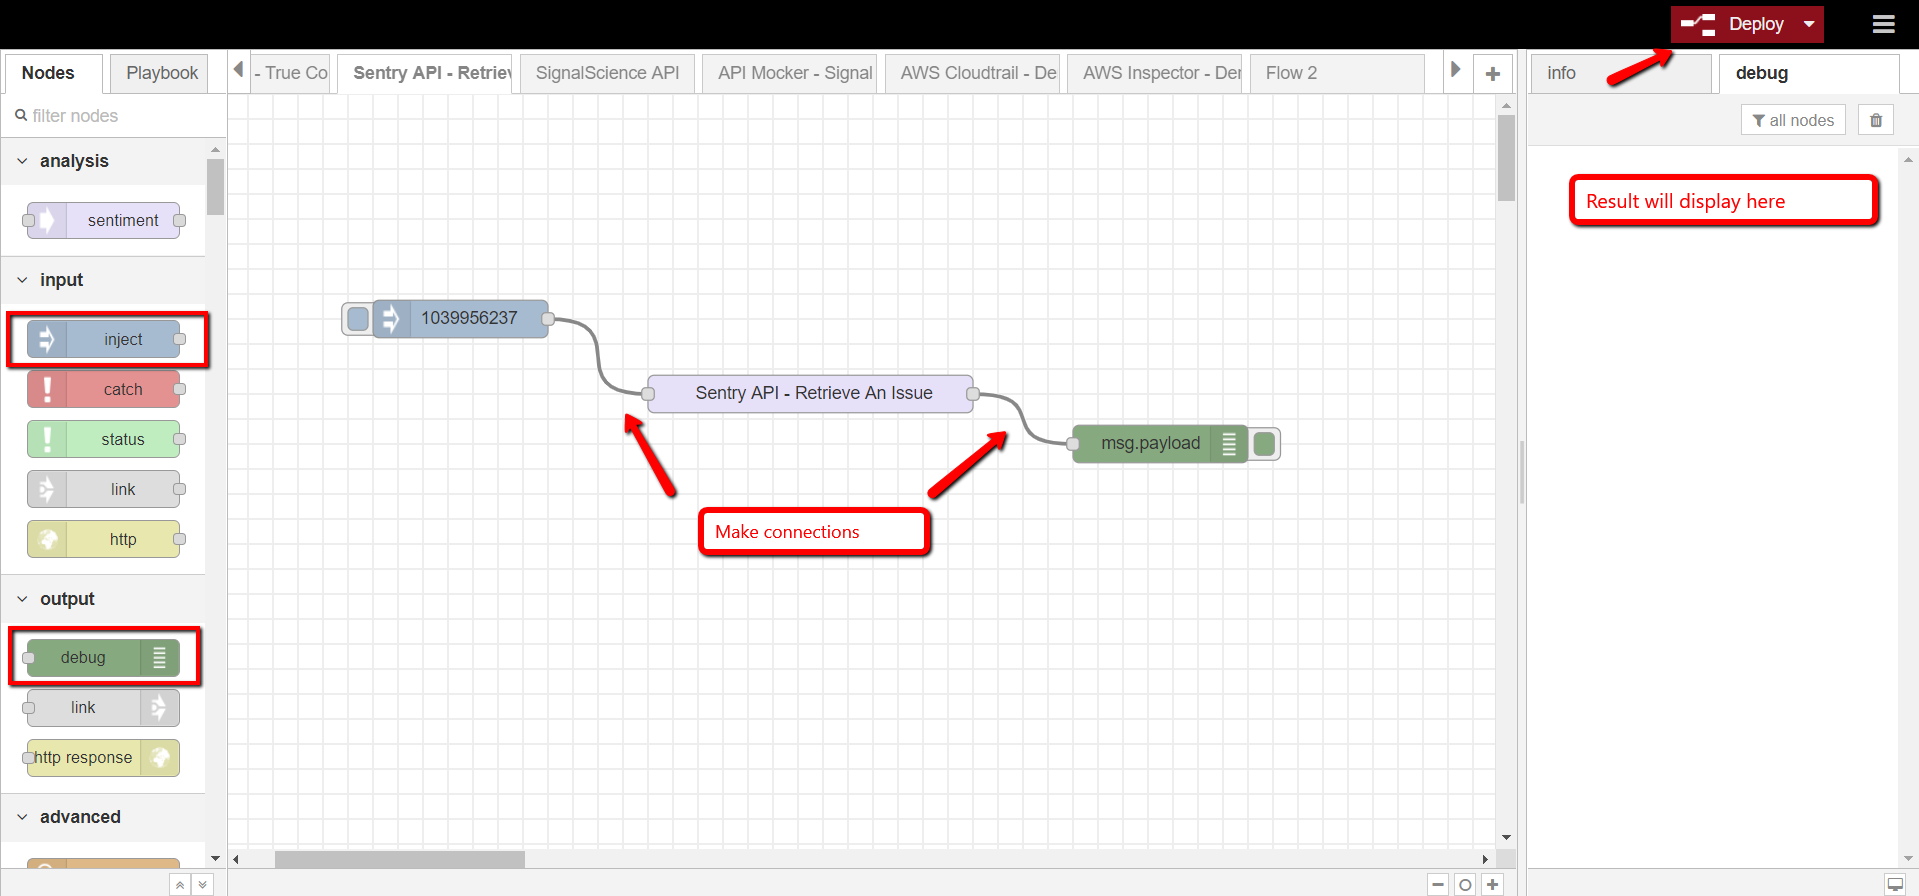
- 4. Test the Sentry node
- Drag and drop INJECT node and DEBUG node to the workspace with the first connecting to the input of RETRIEVE AN ISSUE node and the latter connecting to the output of RETRIEVE AN ISSUE node
- Provide event ID in the message payload of the INJECT node and then click Save to see the result
ServiceNow
Actions supported :
- ticket action
- get ticket
ticket action
Create/Update A Ticket in ServiceNow.
get ticket
Get ticket in ServiceNow.
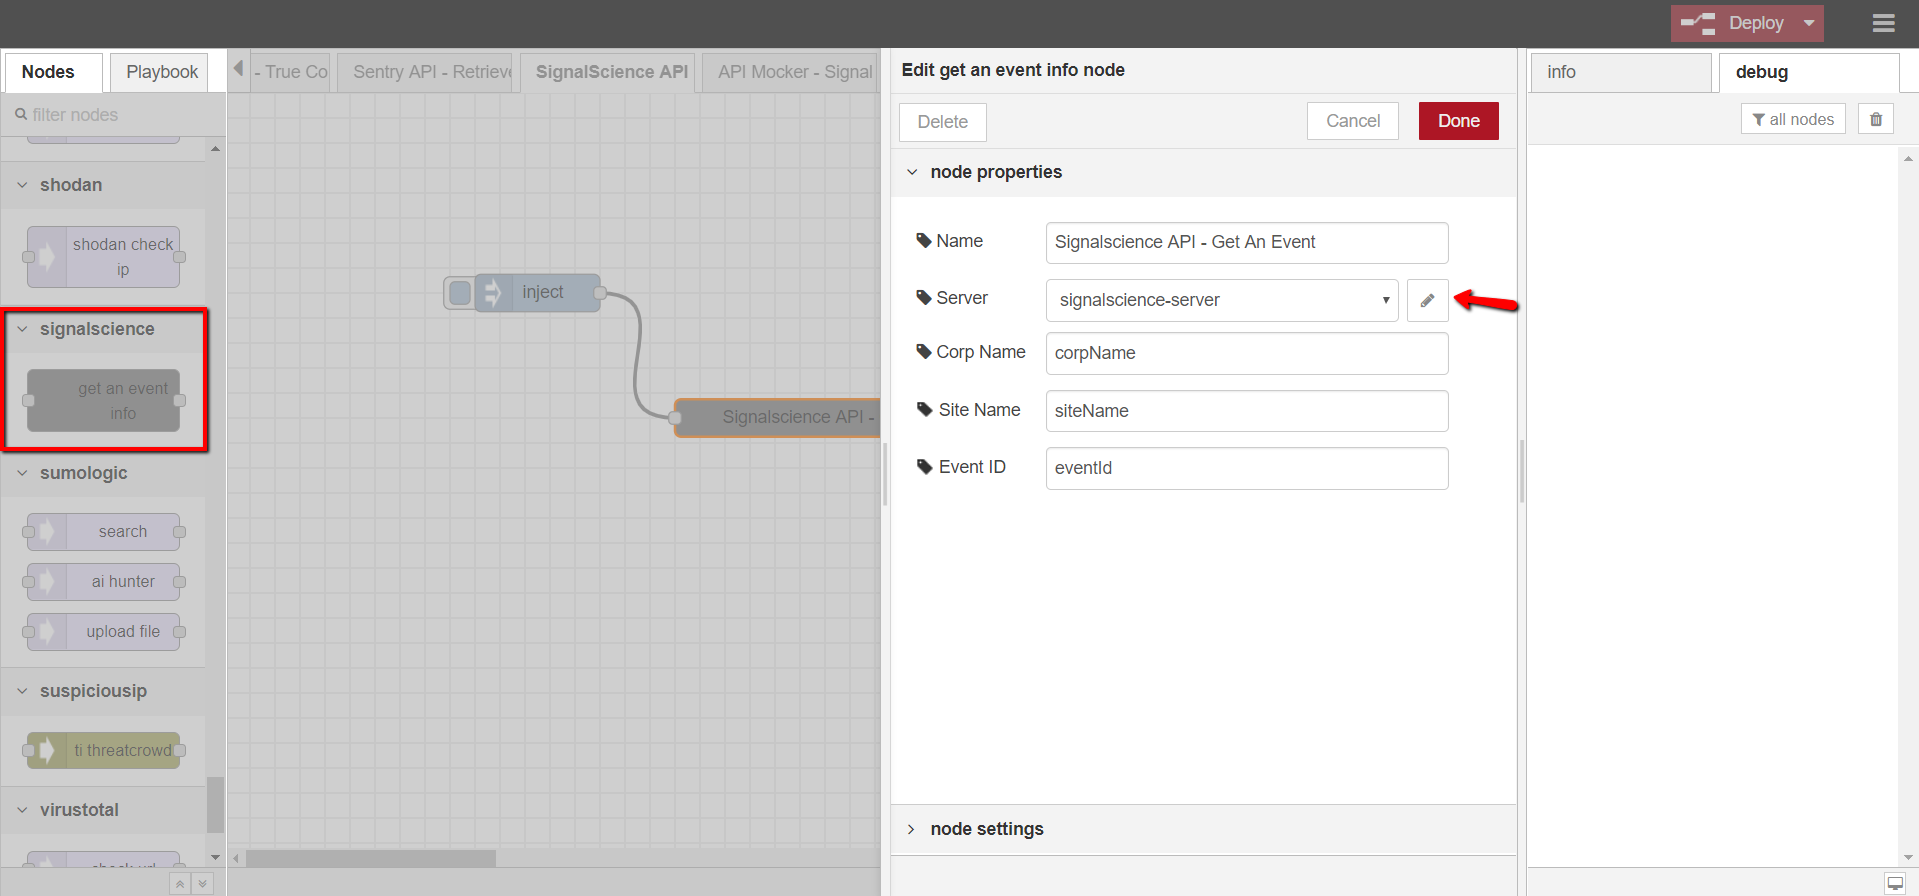
Signal Science
Actions supported :
- get an event info
get an event info
Retrieve alerts from signal science platform.
- 1. Log in/Sign up your Signal Science account
- Simply log into your created account.
- 2. Create API users and authentication
- Refer to Signal Science API docs for how-to: https://docs.signalsciences.net/developer/using-our-api/
- 3. Configure the Signal Science node
- Open DTonomy Workflow, drag and drop signalscience -> GET AN EVENT INFO node to the workspace
- Double-click on the node to configure it
- Provide node name (optional), server info (use the authentication from step 2), corporation name, site name, and event ID (optional) from step 2
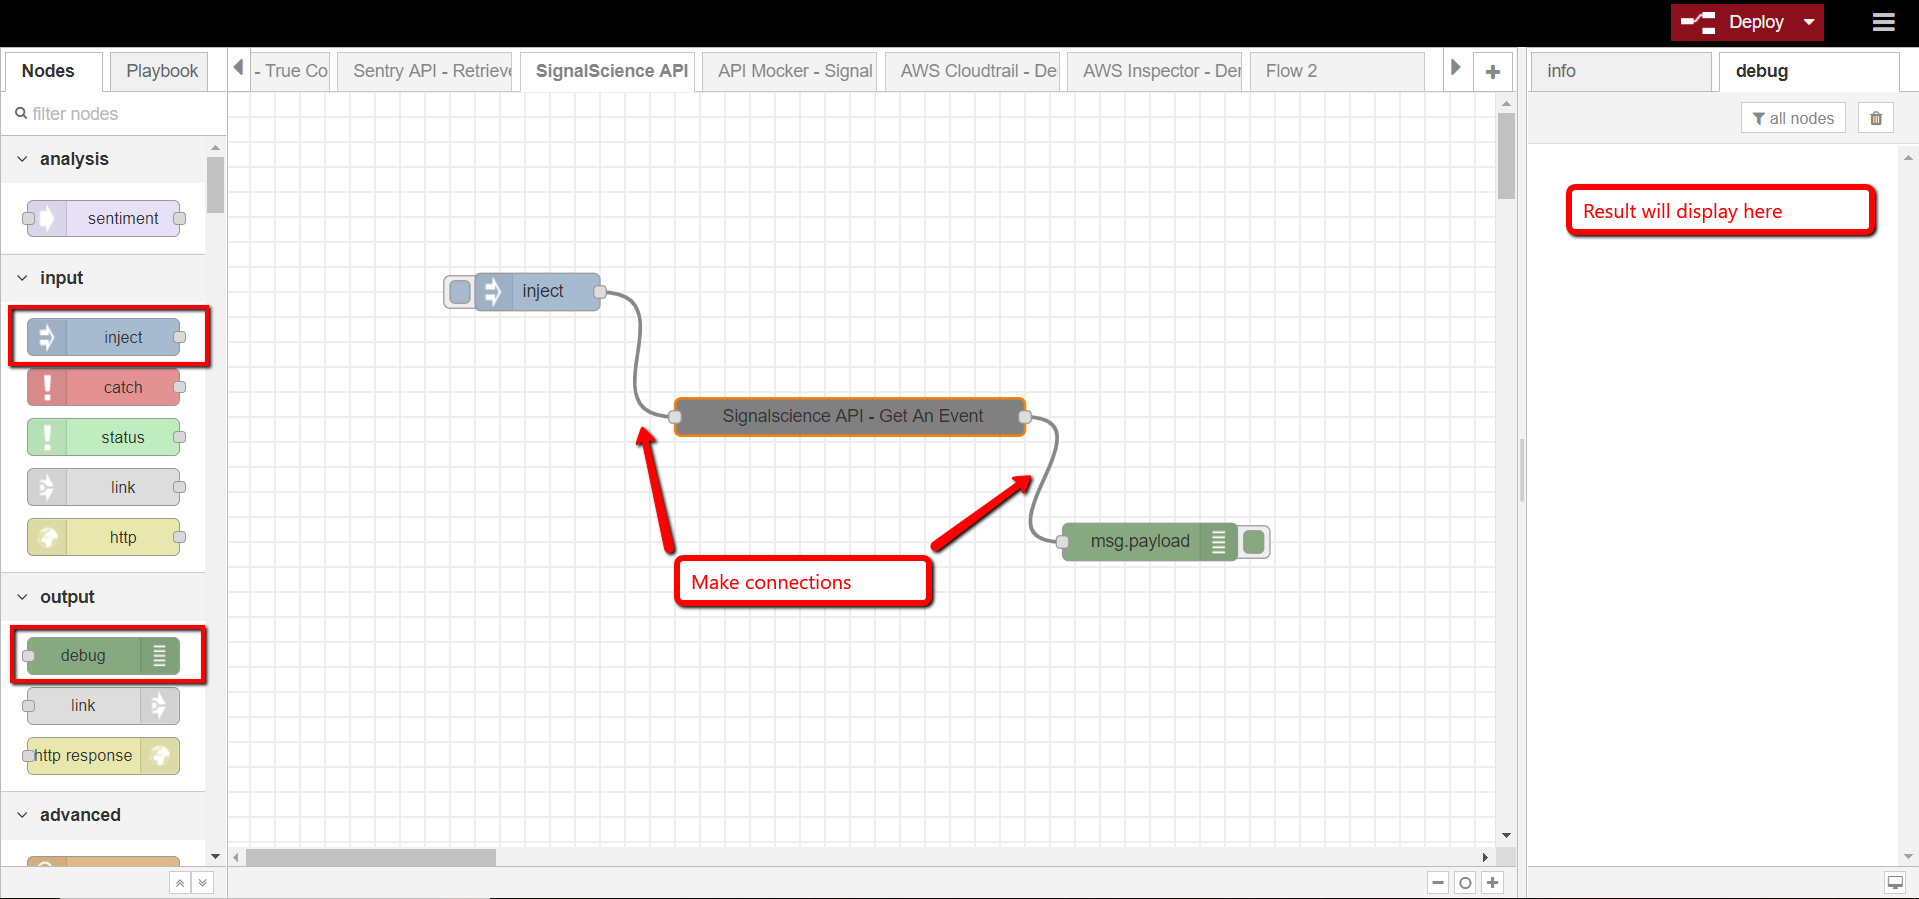
- 4. Test the Signal Science node
- Drag and drop INJECT node and DEBUG node to the workspace with the first connecting to the input of GET AN EVENT INFO node and the latter connecting to the output of GET AN EVENT INFO node
- Provide event ID in the message payload of the INJECT node and then click Save to see the result
Splunk
The Splunk Node lets users integrate with Splunk’s functionality: users can query their (log) data within Splunk Cloud. (Ref: https://docs.splunk.com/Documentation/Splunk/7.2.6/RESTTUT/RESTandCloud)
- 1. Log in/ Sign up your Splunk Cloud Account
- Simply log into your desired Splunk Cloud account https://login.splunk.com/.
2. Prepare Credentials: url, port, user name, password
- 3. Navigate to DTonomy Panel
6.1 Search and drag “Splunk” from left panel to palette.
6.2 Configure Splunk Server with information in step 2.
6.3 Configure query parameter and query body.
4. See Result
Sumo Logic
Actions supported :
- search
- ai hunter
- upload file
Search
Search alerts/data from sumo logic platform
- Search
- Query a search in Sumologic.
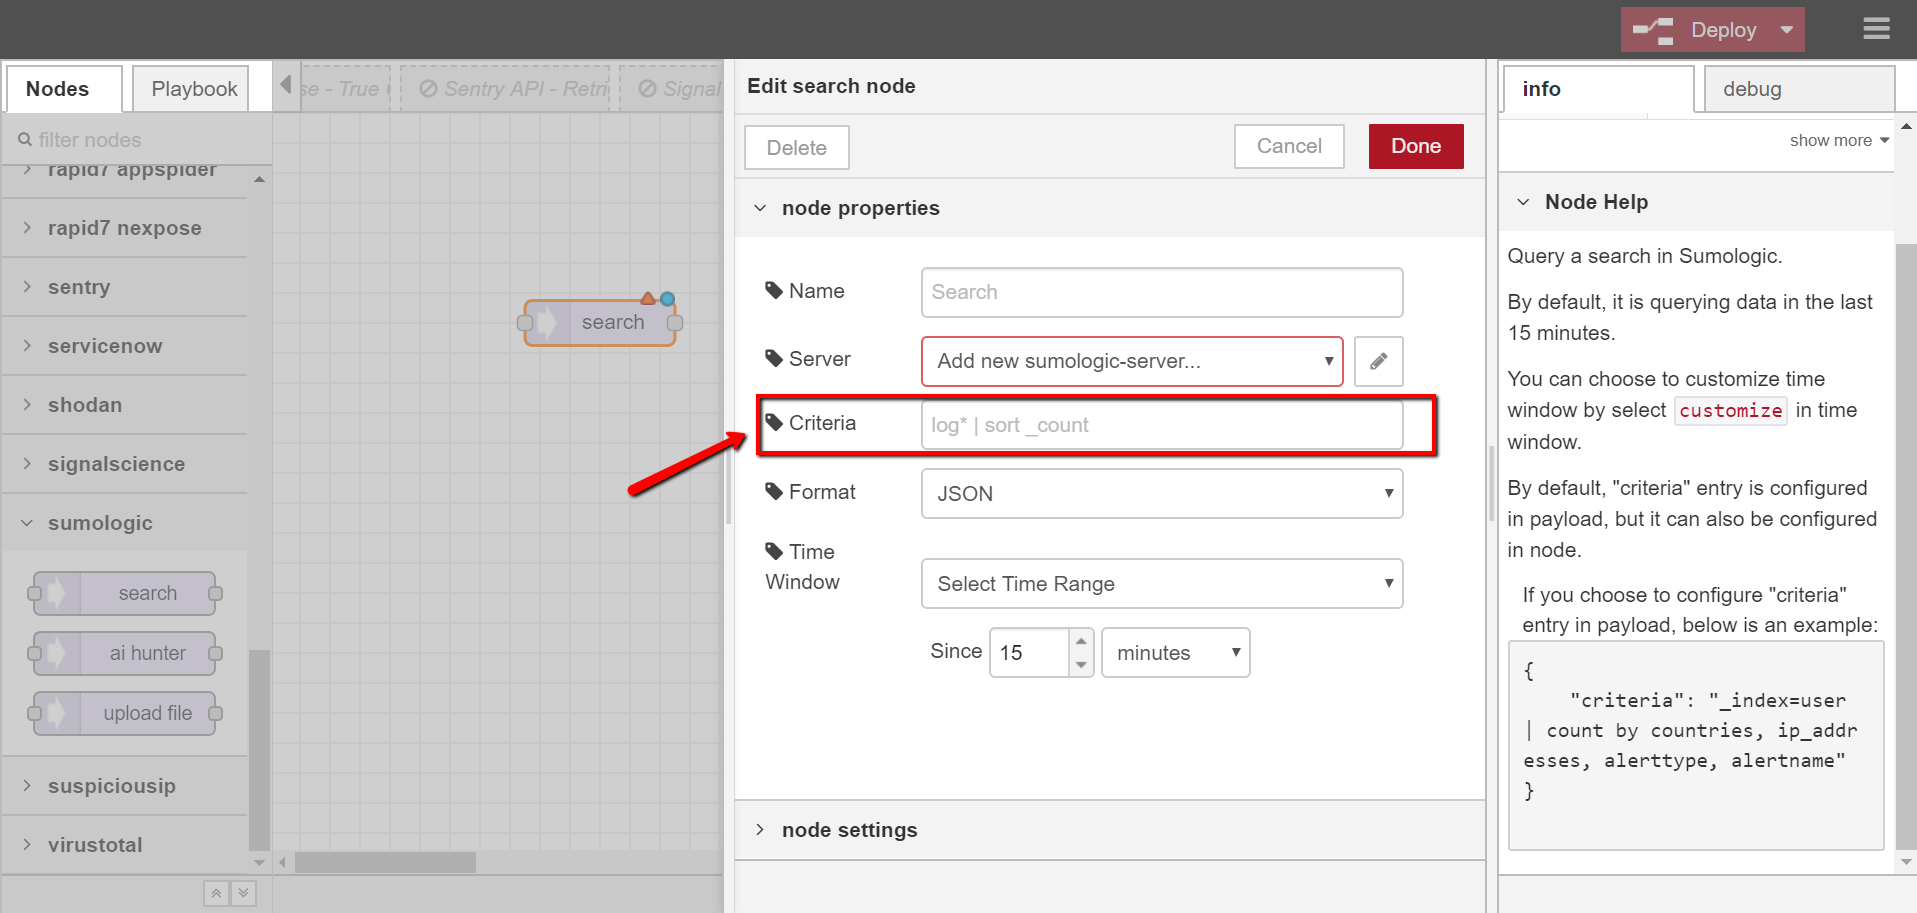
- By default, it is querying data in the last 15 minutes.
- You can choose to customize time window by select customize in time window.
- By default, “Criteria” entry is configured in payload, but it can also be configured in node.
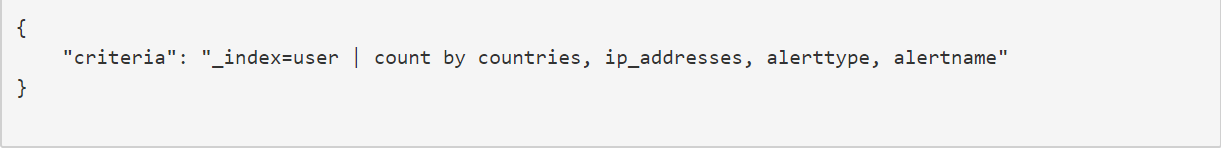
- If you choose to configure “Criteria” entry in payload, below is an example:
Upload file
Upload file to Sumo Logic platform
- Upload File
- Inputs from payload.
- Payload contains the log file content to upload.
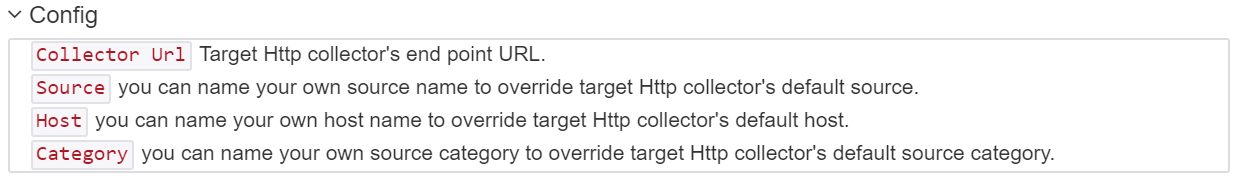
- Config
Below is config instruction.
- Output
Output message indicates whether upload is successful.
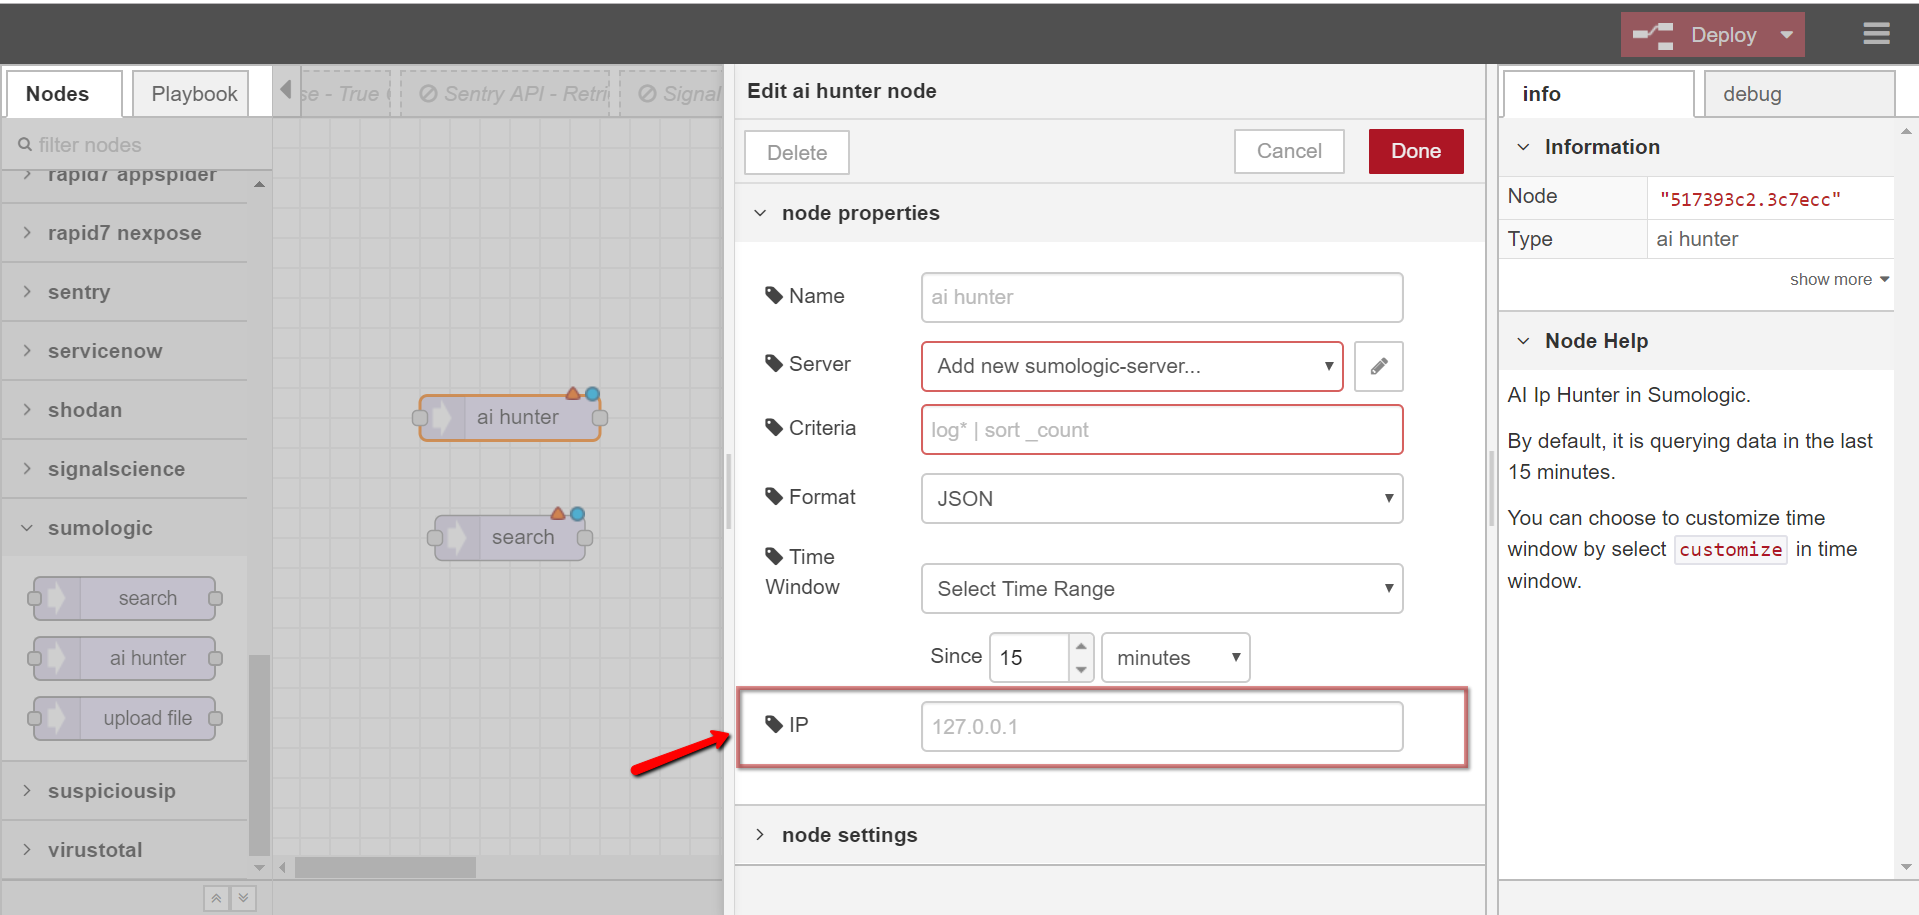
AI Hunter (Deprecated)
AI Ip Hunter in Sumologic.
- AI Hunter (Deprecated)
- Query a search with ip in Sumologic.
- By default, it is querying data in the last 15 minutes.
- You can choose to customize time window by select customize in time window.
SuspiciousIp
Actions supported :
- ti threatcrowd
ti threatcrowd
Pull Threat Intelligence Information from threatcrowd.
Tenable io
Actions supported :
- list scans
- get scan result
- launch scan
list scans
List all scans.
get scan result
Get scan result by scan id.
launch scan
Launch a Scan schedule.
Tenable sc
Actions supported :
- list scans sc
- list assets sc
list scans sc
Get list of scanners for tenable sc.
list assets sc
Get list of assets for tenable sc.
Actions supported :
- autossh
autossh
Connect to any remote machine and execute commands using SSH and return the output.
URLScan.io
Actions supported :
- search domain
- scan domain
search domain
Search public scan results for domain on urlscan.io.
scan domain
Submit a scan on urlscan.io for the domain and get results.
VirusTotal
Actions supported :
- check url
- check domain
- check ip
- check file
check url
Retrieve url scan results.
check domain
Retrieve domain scan results.
check ip
Retrieve ip intelligence information.
check file
Retrieve scan results on file hash.
Wazuh
Actions supported :
- explore rule set
- wazuh index query
explore rule set
Explore the ruleset of an alert with server ip and rule id.
wazuh index query
Query Wazuh index and return results.
Share Workflows
You can share workflows with other users in JSON format.
Export a workflow to JSON
- Select the nodes and connections that you want to export by pressing and holding the mouse.
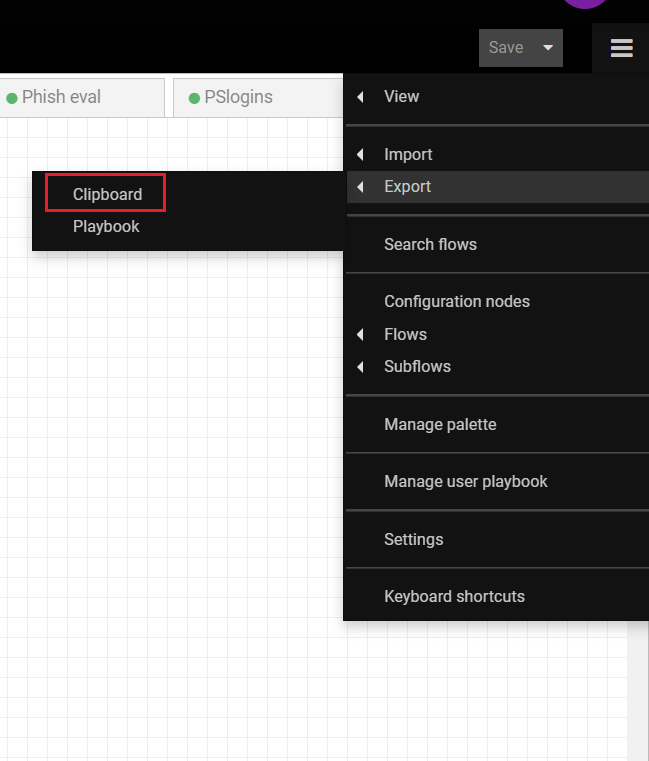
- Select “Export -> Clipboard” from the menu on upper right corner.
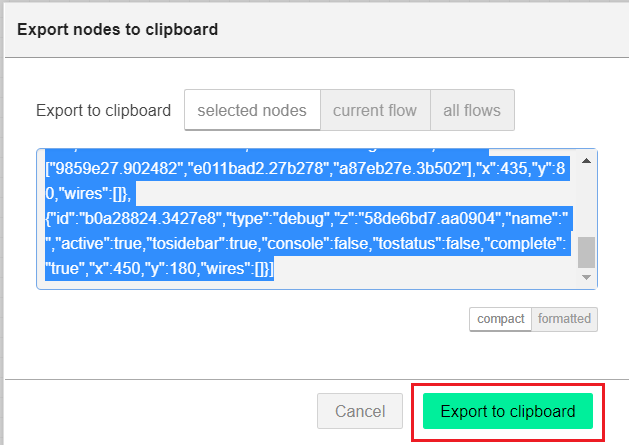
- A dialog window will pop up with the selected nodes and connections in the format of JSON. Click on “Export to clipboard” button then you can paste to a file and share with other users.
Import a workflow from JSON
- Select “Import -> Clipboard” from the menu on upper right corner.
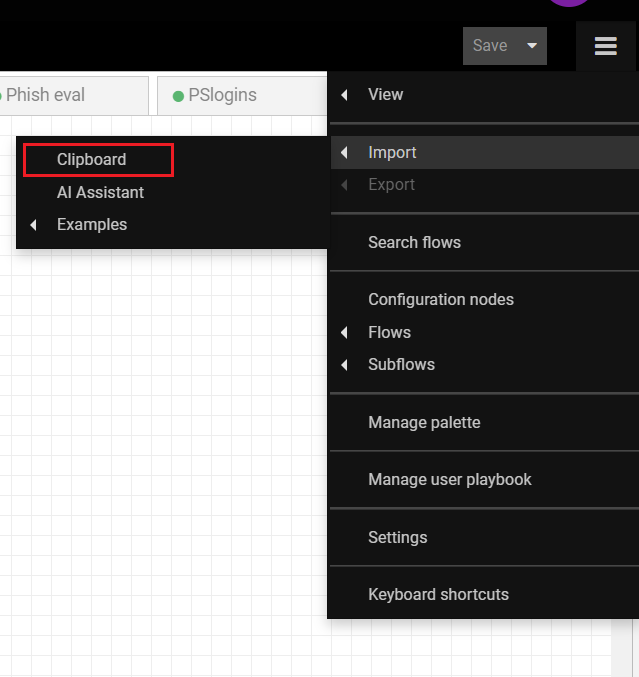
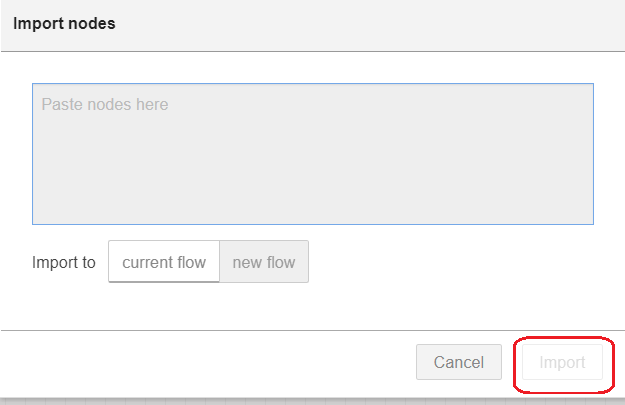
- A dialog window will pop up. Paste the JSON into the center panel, then click on “Create” button.
Project History
Backed by a Git repository, all of the files are fully version controlled. So users can browse and compare the historical versions of the files.
Version Control
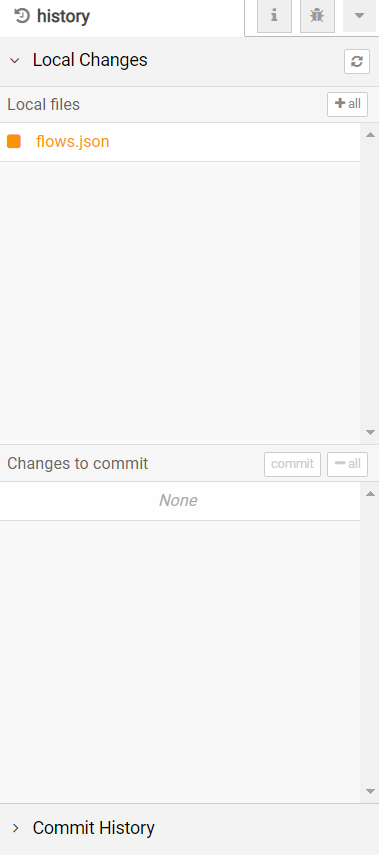
A new “history” tab has been added to the sidebar. This is where you manage the version control of your files. The tab has two sections:
- Local Changes - shows files that have changed, allowing you to stage and commit them.
- Commit History - a list of all commits in the repository.
Local Changes
Whenever you change a file, such as by deploying a new flow configuration, it will be listed in the ‘Local files’ section. You can click on the file name to see a diff of what has changed. When you hover over the file, you’ll see a + button - clicking that will stage the file - moving it down to the ‘Changes to commit’ list.
When you have staged the files you want to commit, click the commit button, enter a message and confirm.
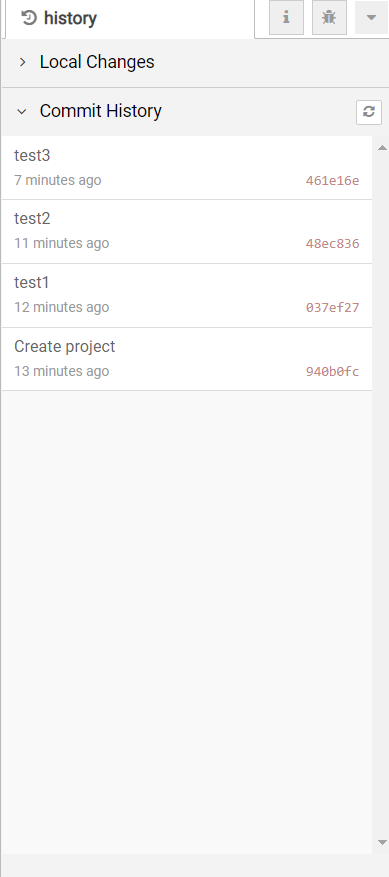
Commit History
The Commit History section lists all of the commits in the repository. DTonomy has automatically committed the initial set of default files for the project.
This is one area that DTonomy tries to simplify the user experience, and doesn’t expose all of the various options Git provides. This is an area we welcome feedback on. For example, it does not provide options to rebase your local commits.
Social Functions
Actions supported :
Email (receive)
Email (send)
Random Quotes
Slack
Slack Bot In
Slack Bot out