Getting Started
Overview
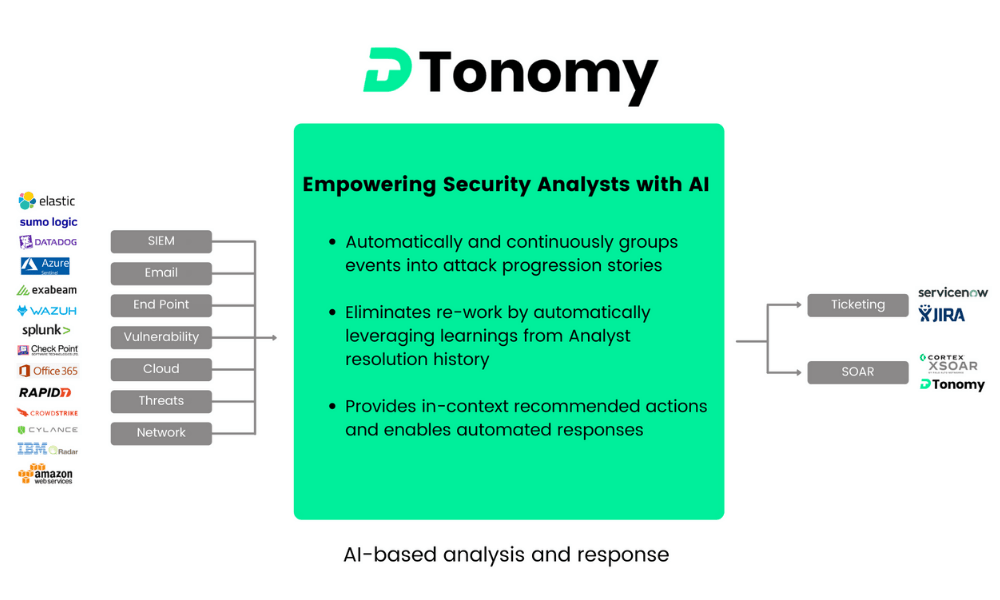
DTonomy’s AI-Based Analysis and Response (AIR) enables security teams to more quickly identify the risks buried in their detection events (aka Alerts), spend less time on false positives, and more quickly respond to security issues when they occur. DTonomy customers have been able to reduce investigation time by as much as 80%, as well as eliminate the risk that comes from uninvestigated alerts.
DTonomy AIR consolidates security detections, automatically correlates detections to streamline security investigation, generates in-context recommended actions, and enables automated responses.
Access DTonomy
To sign into DTonomy you need a tenant. A tenant is created when you purchase a DTonomy plan or when you sign up for community edition. Reach out to info@dtonomy.com for any questions.
Architecture
DTonomy takes alerts from variety security monitoring/detection tools such as
- SIEM
- End point
- Vulnerability
- Cloud
- Threats
- Network
and then goes through our AI based engine for analysis and response. It has hundreds of integrations with third party tools to enable you to take actions automatically. Example of actions include
- create a ticket
- quarantine a machines
- notify someone
- query SIEM logs
- reset password
- etc.
Here is an overview of the architecture.
Quick Start
DTonomy AIR enables teams to process daily security alerts and response with automation. This tutorial walks you thru the steps required to start processing sample alerts data.
- Ingest Alerts to DTonomy
- Setup DTonomy intelligent case correlation
- Review scores, timeline, visualizations and recommended actions.
- Resolve alerts with automated actions.
Ingestion
DTonomy automates data ingestion and artifacts extraction through drag and drop workflow.
On automation menu, click “Investigate Sample Alerts” tab. On the automation canvas, click left side of “Trigger”, it will automatically upload sample data to our platform.
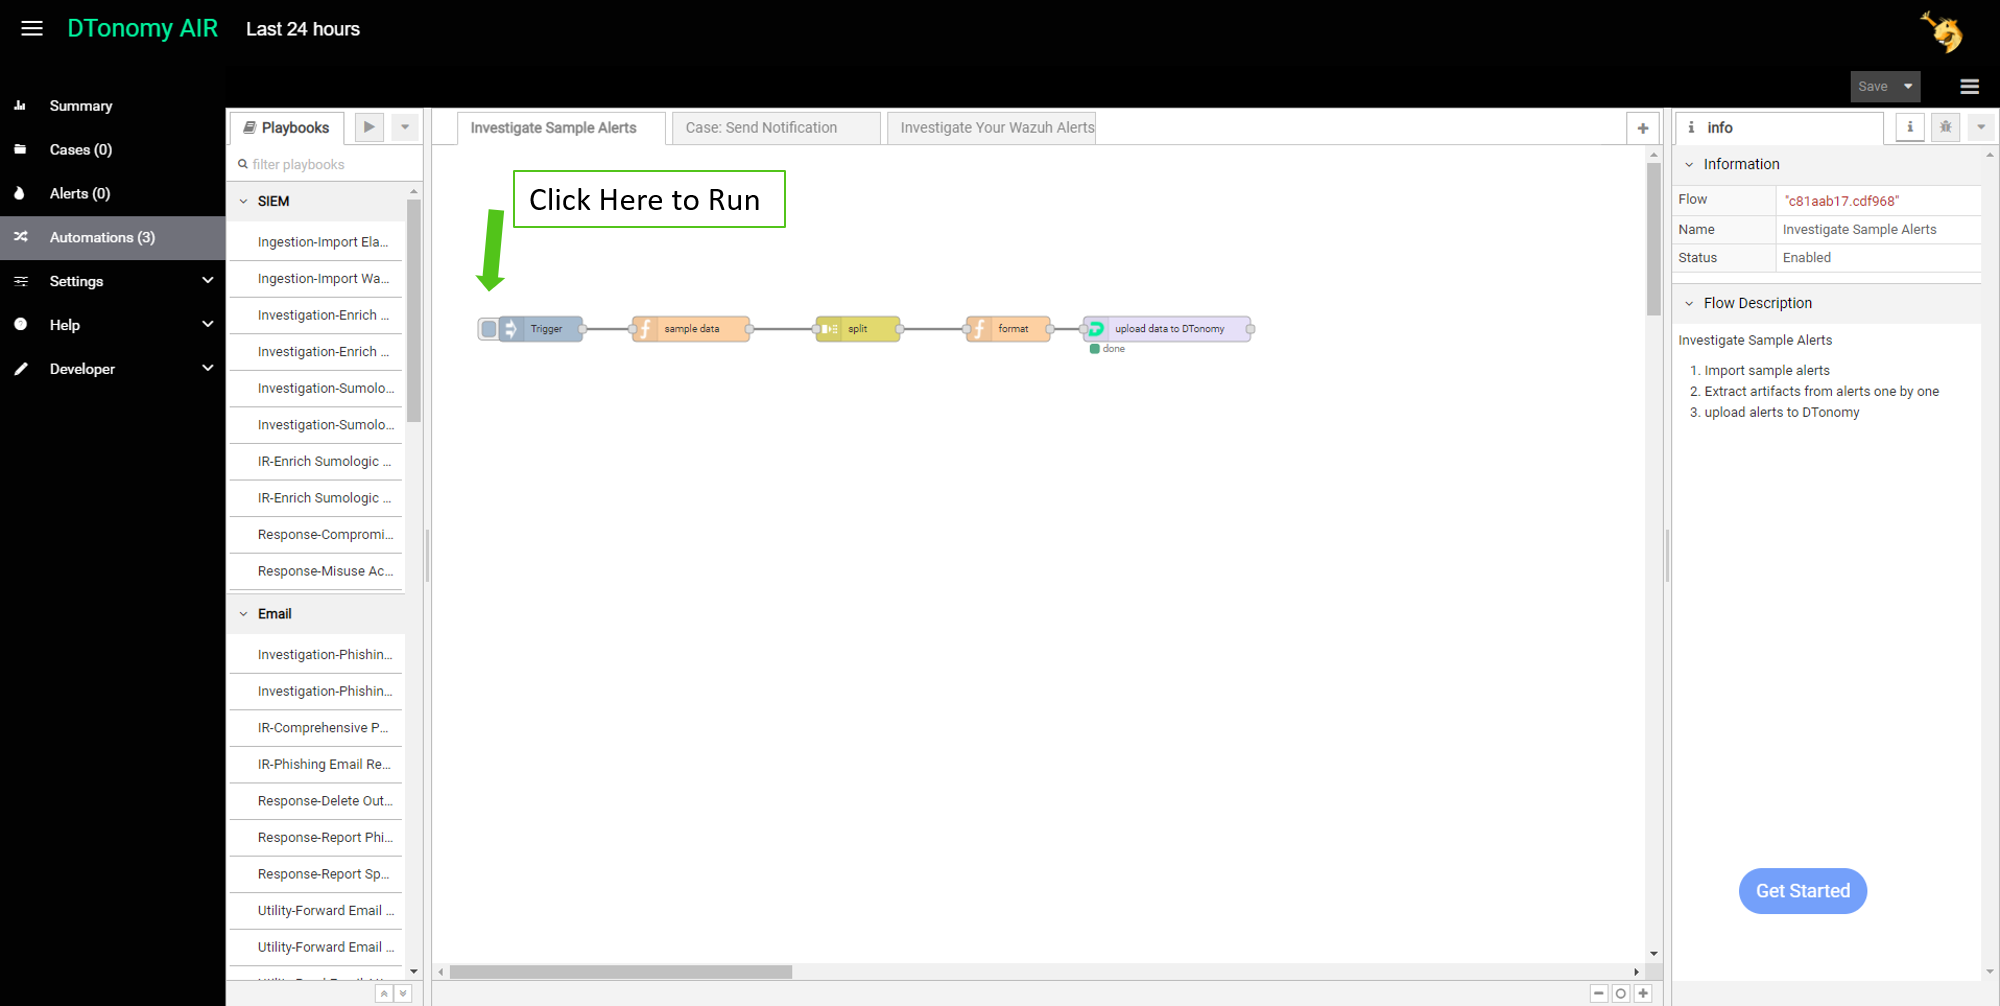
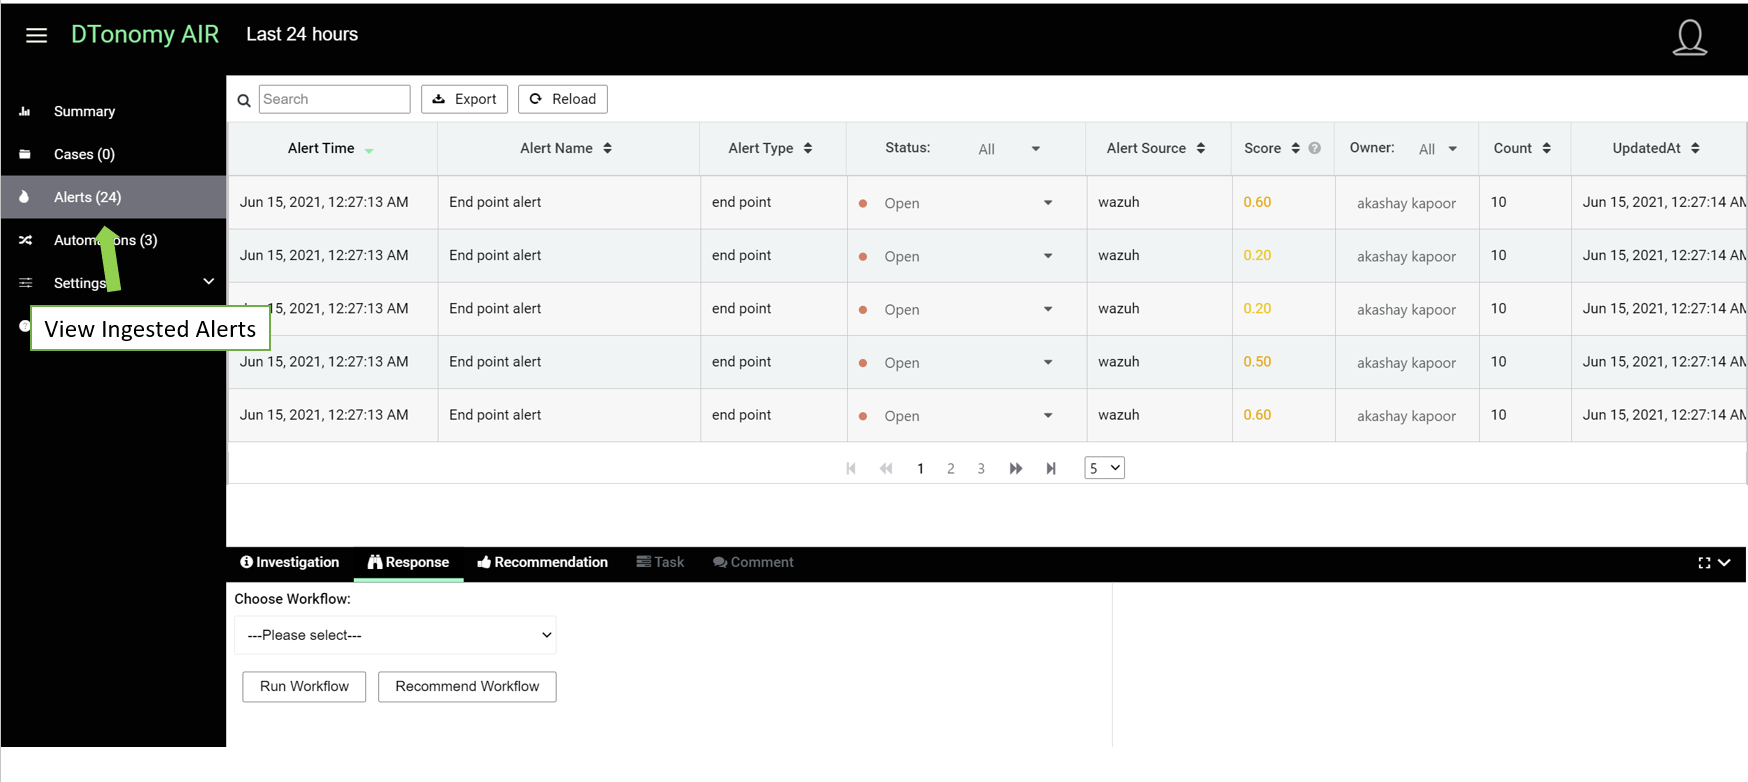
After ingestion, you should be able to view alerts by clicking Alerts menu.
Case Creation
This step enables you to set up correlation for automating case creation. (Upgrade to professional version to see AI based correlation).
Click case submenu under Settings menu to configure case or you can redirect to case settings under Cases menu.
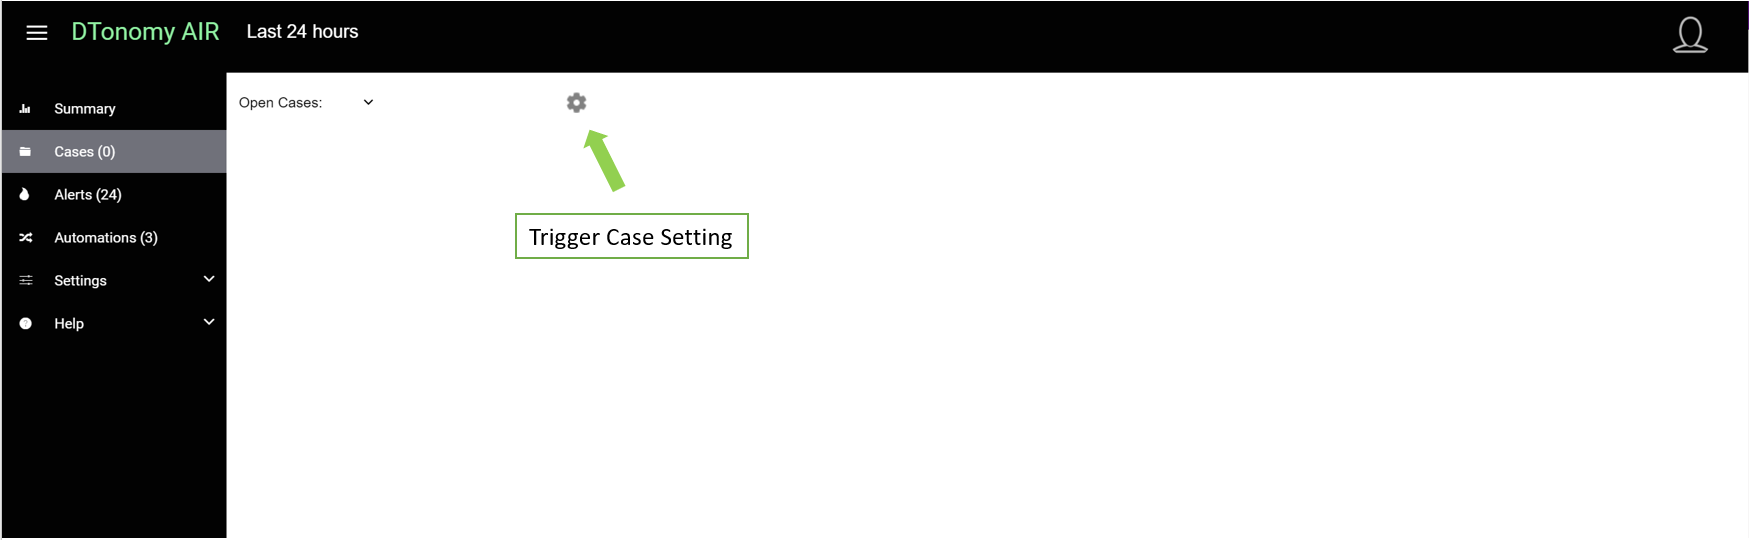
Click “Add New” button to create new cases.
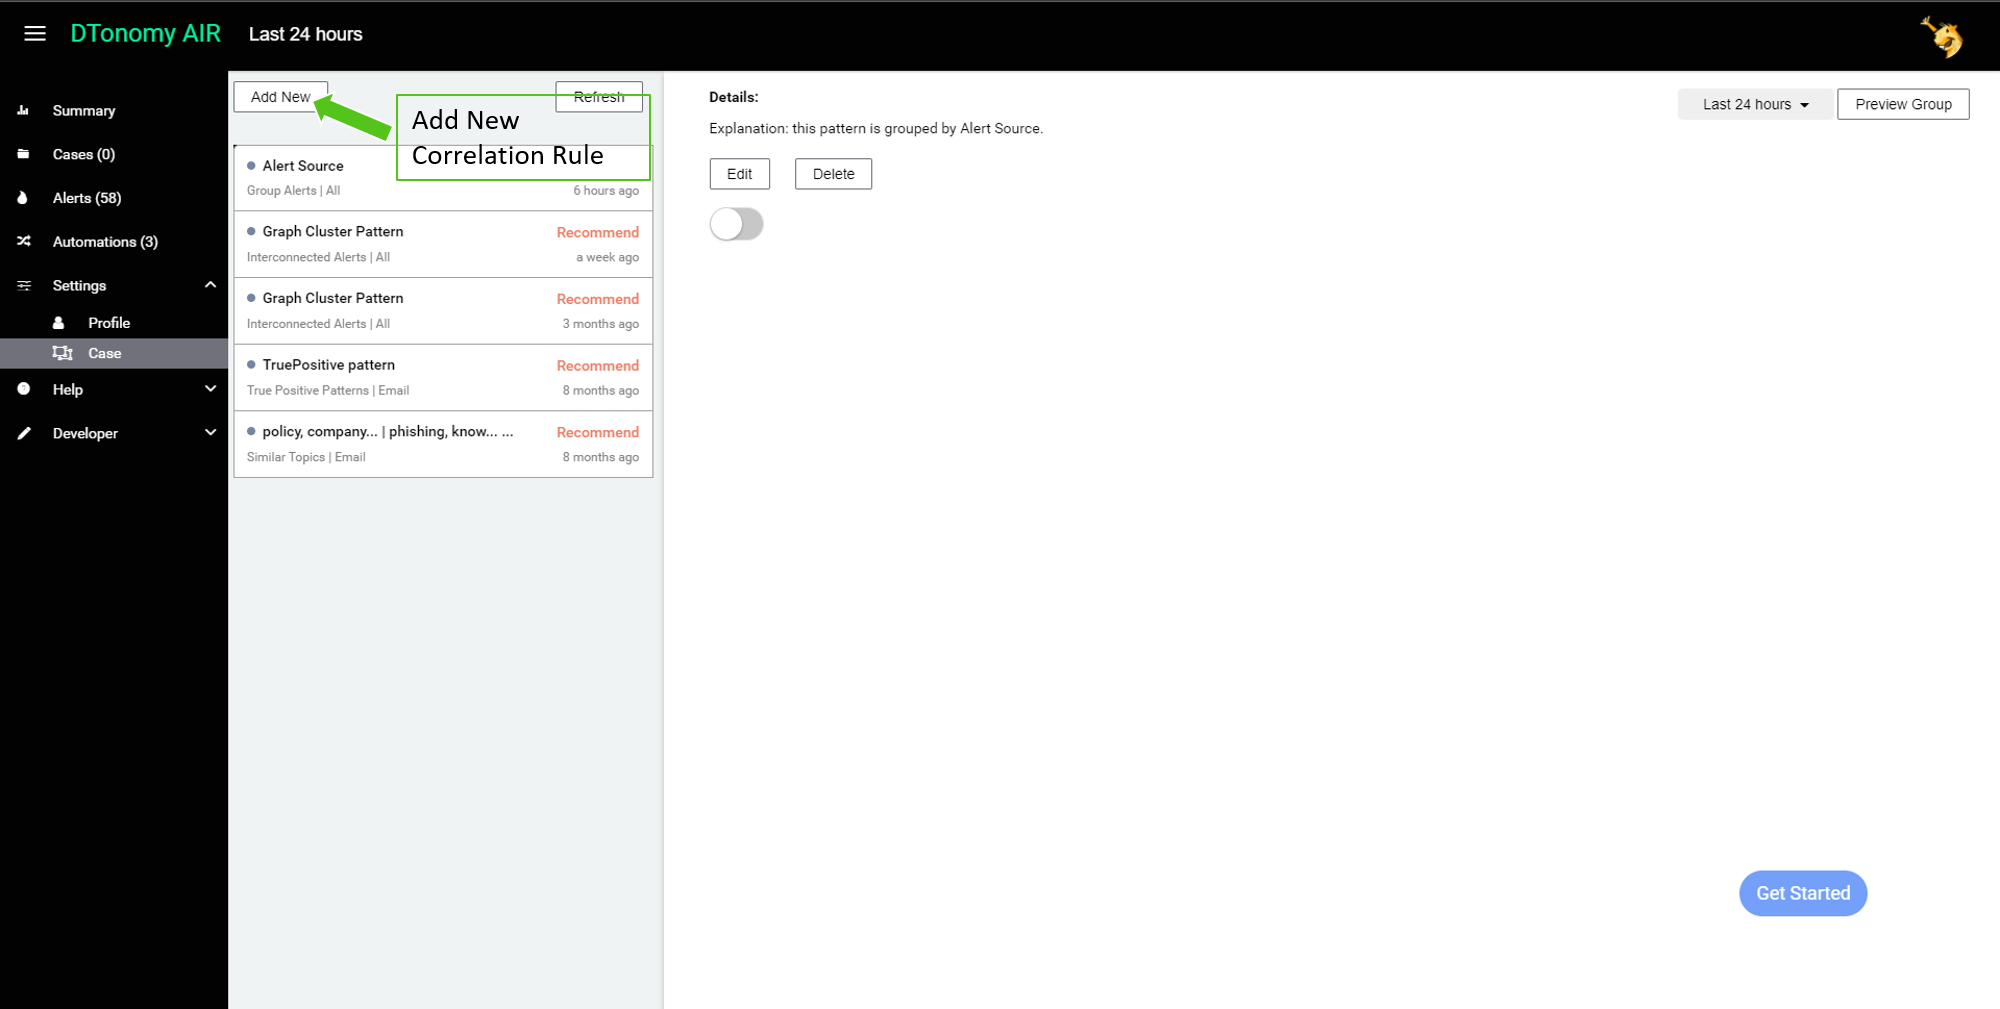
And then select artifacts you would like to correlate by.
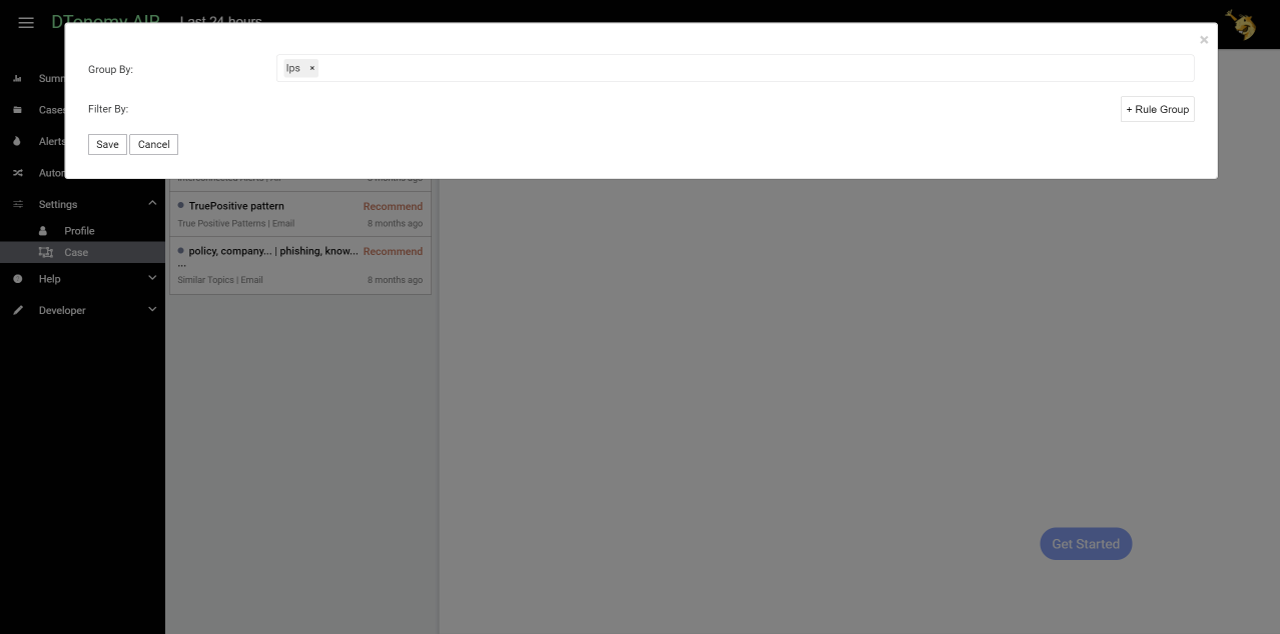
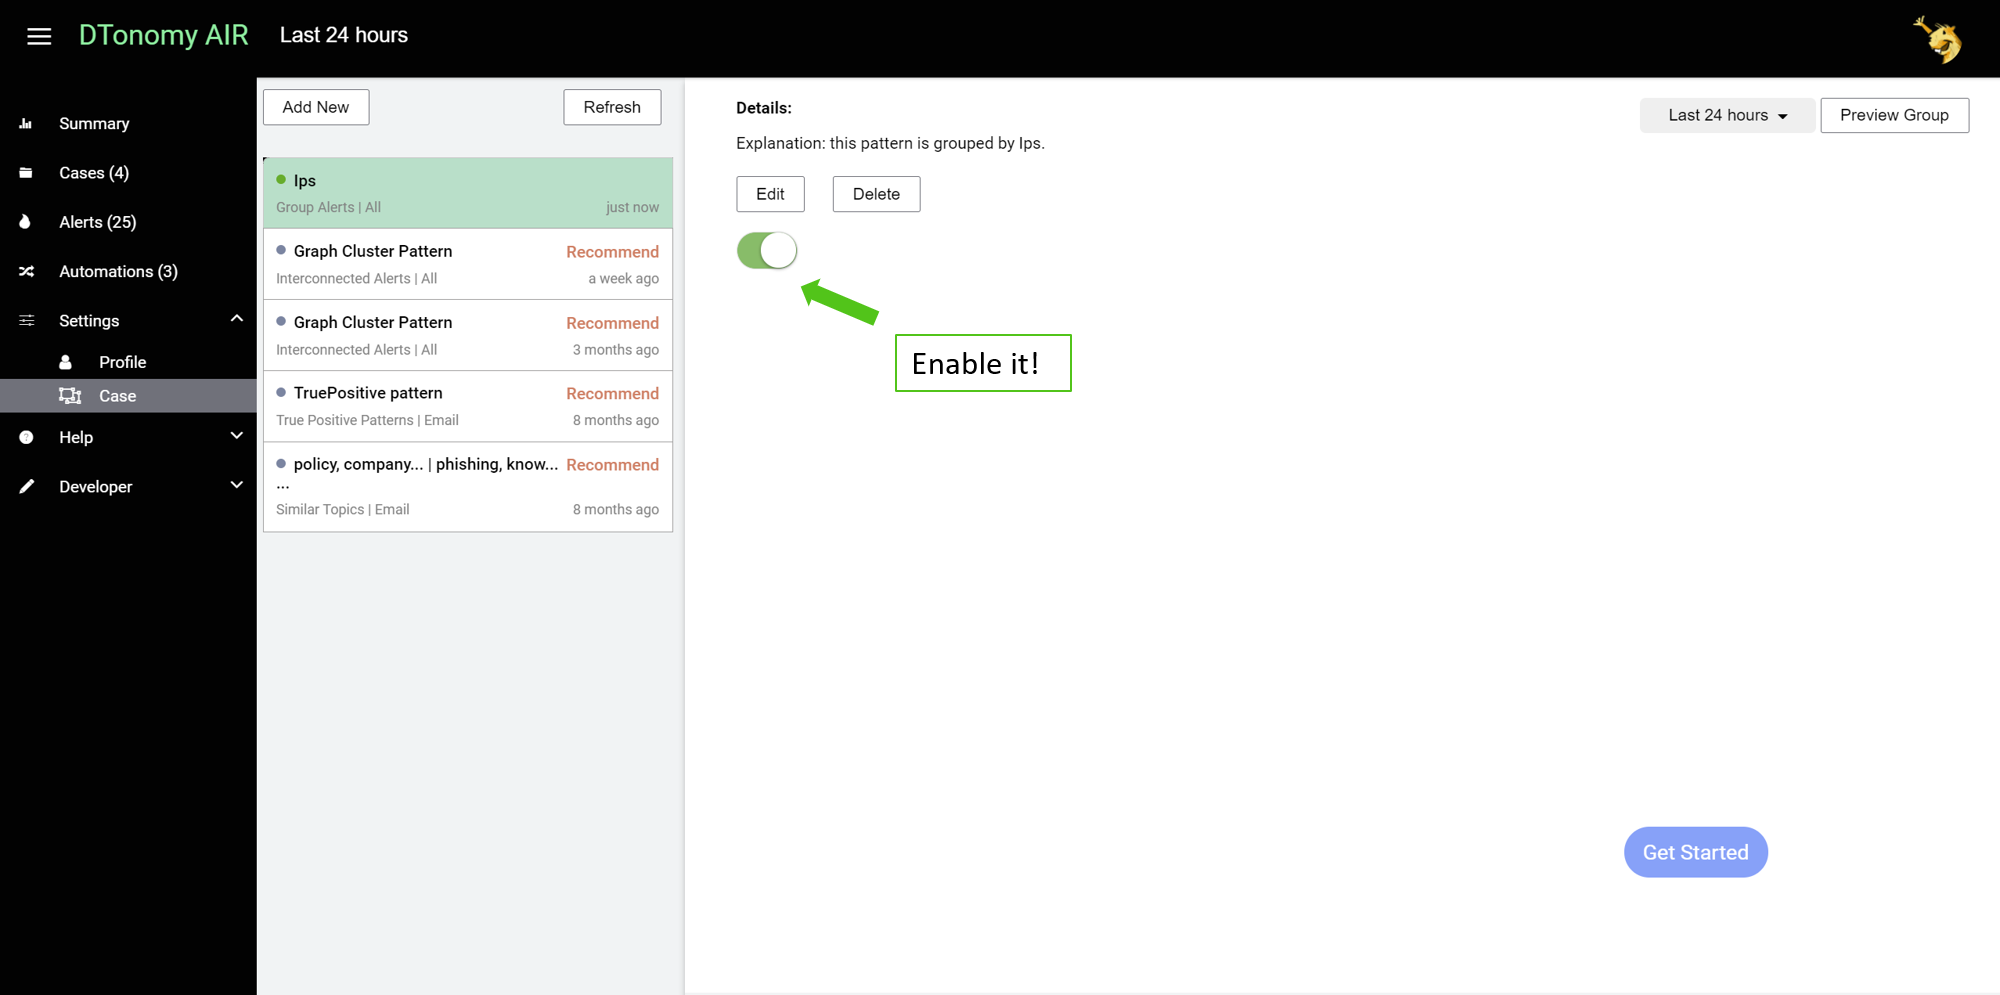
Enable case setting to see your cases continuously.
Analysis
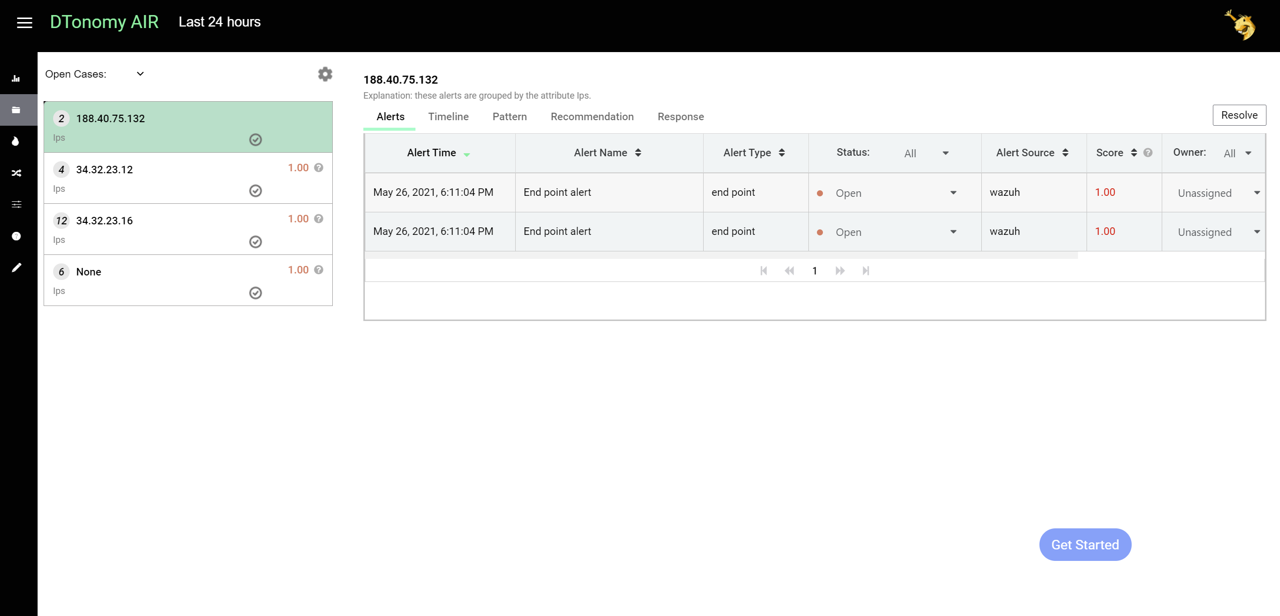
This step enables you to view analysis results, visualization as well as recommended actions. Under cases menu, you can see cases are created automatically.
Response
You can run automated workflow to take actions.
Under response page, select a pre-built actions to complete steps. The action you select is send notification. Click Run workflow, you can see actions are completed.
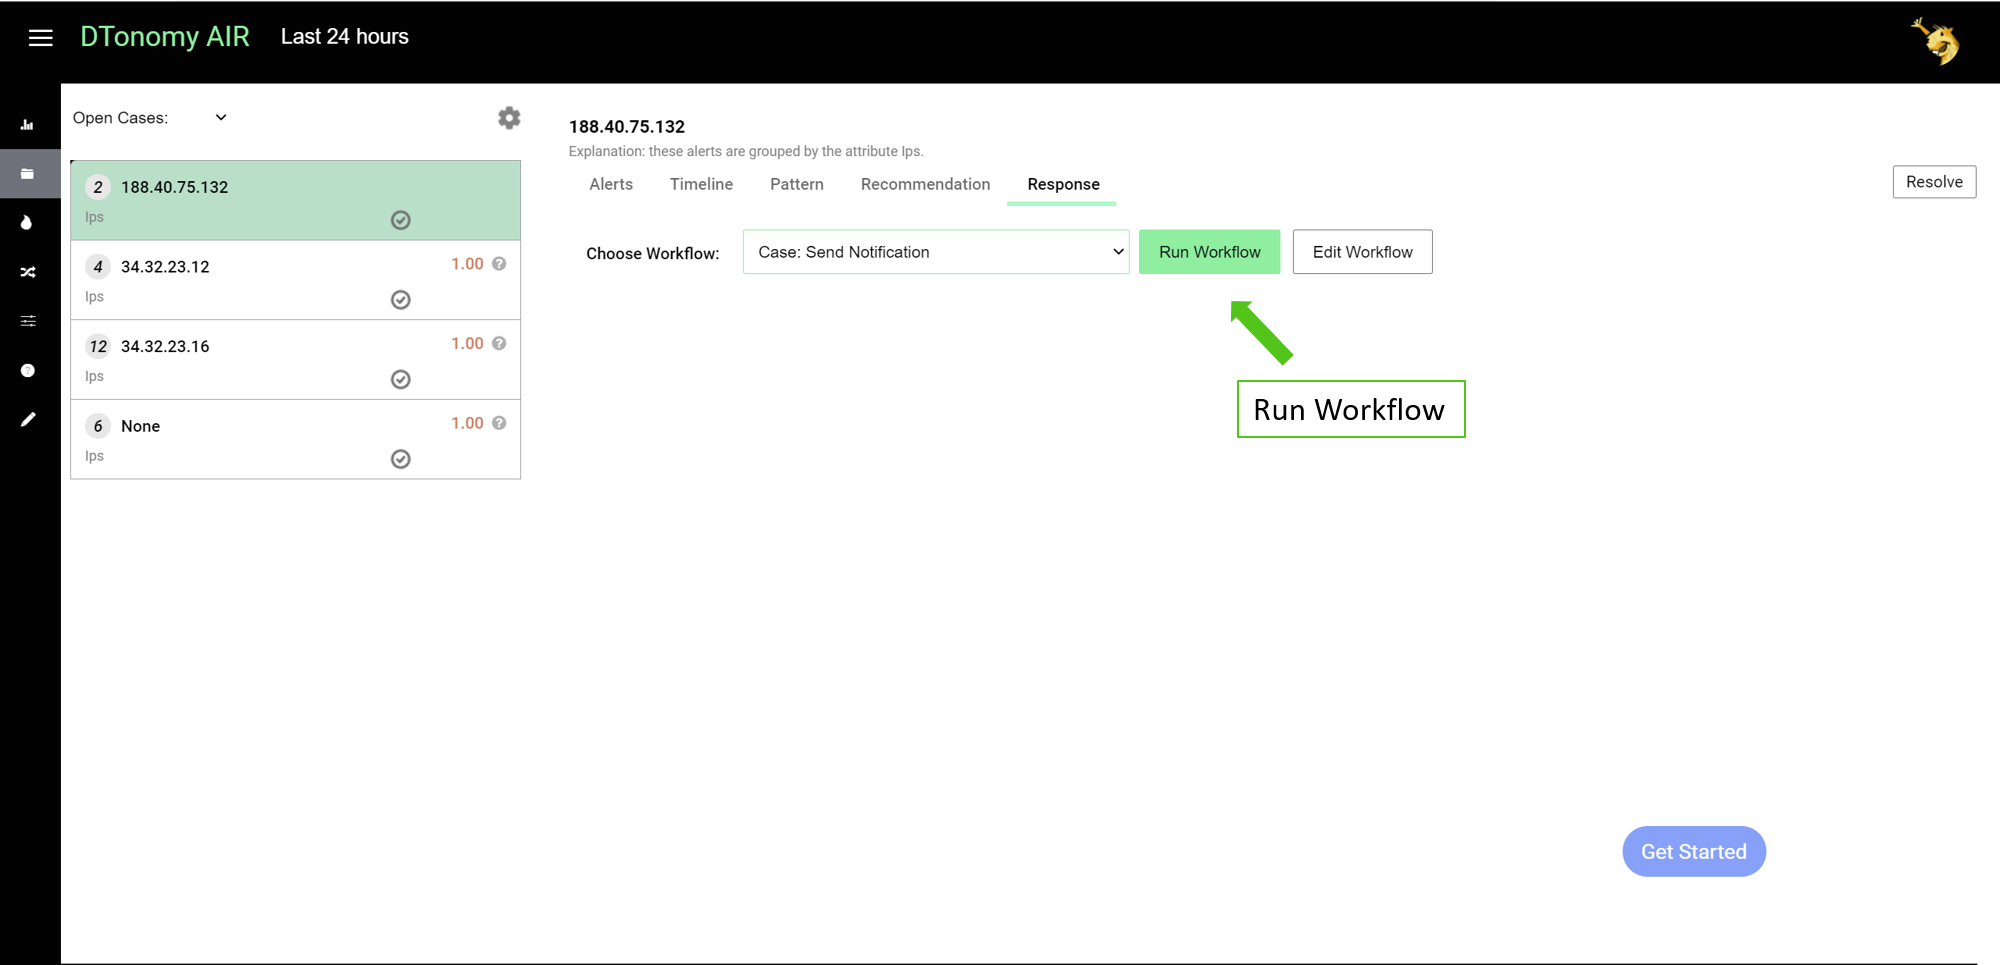
You can click “edit workflow” to modify the automation.
Example Use Cases
DTonomy AIR is built to analyze different types of security alerts. We have compiled different use cases in Playbooks. Here are a few example use cases to get you started:
Phishing Email Analysis
DTonomy AIR has integrations with different email platforms such as GMail and Office 365. Typical steps for analyzing phishing email alerts involve parse email entities such as sender, receiver, urls, attachment and correlate with other threat intelligence. DTonomy has built in playbooks to get you started quickly.
To get started with built in phishing analysis process, here are the steps:
- Select automation menu, under playbooks, click “Analysis Phishing Email” playbook.
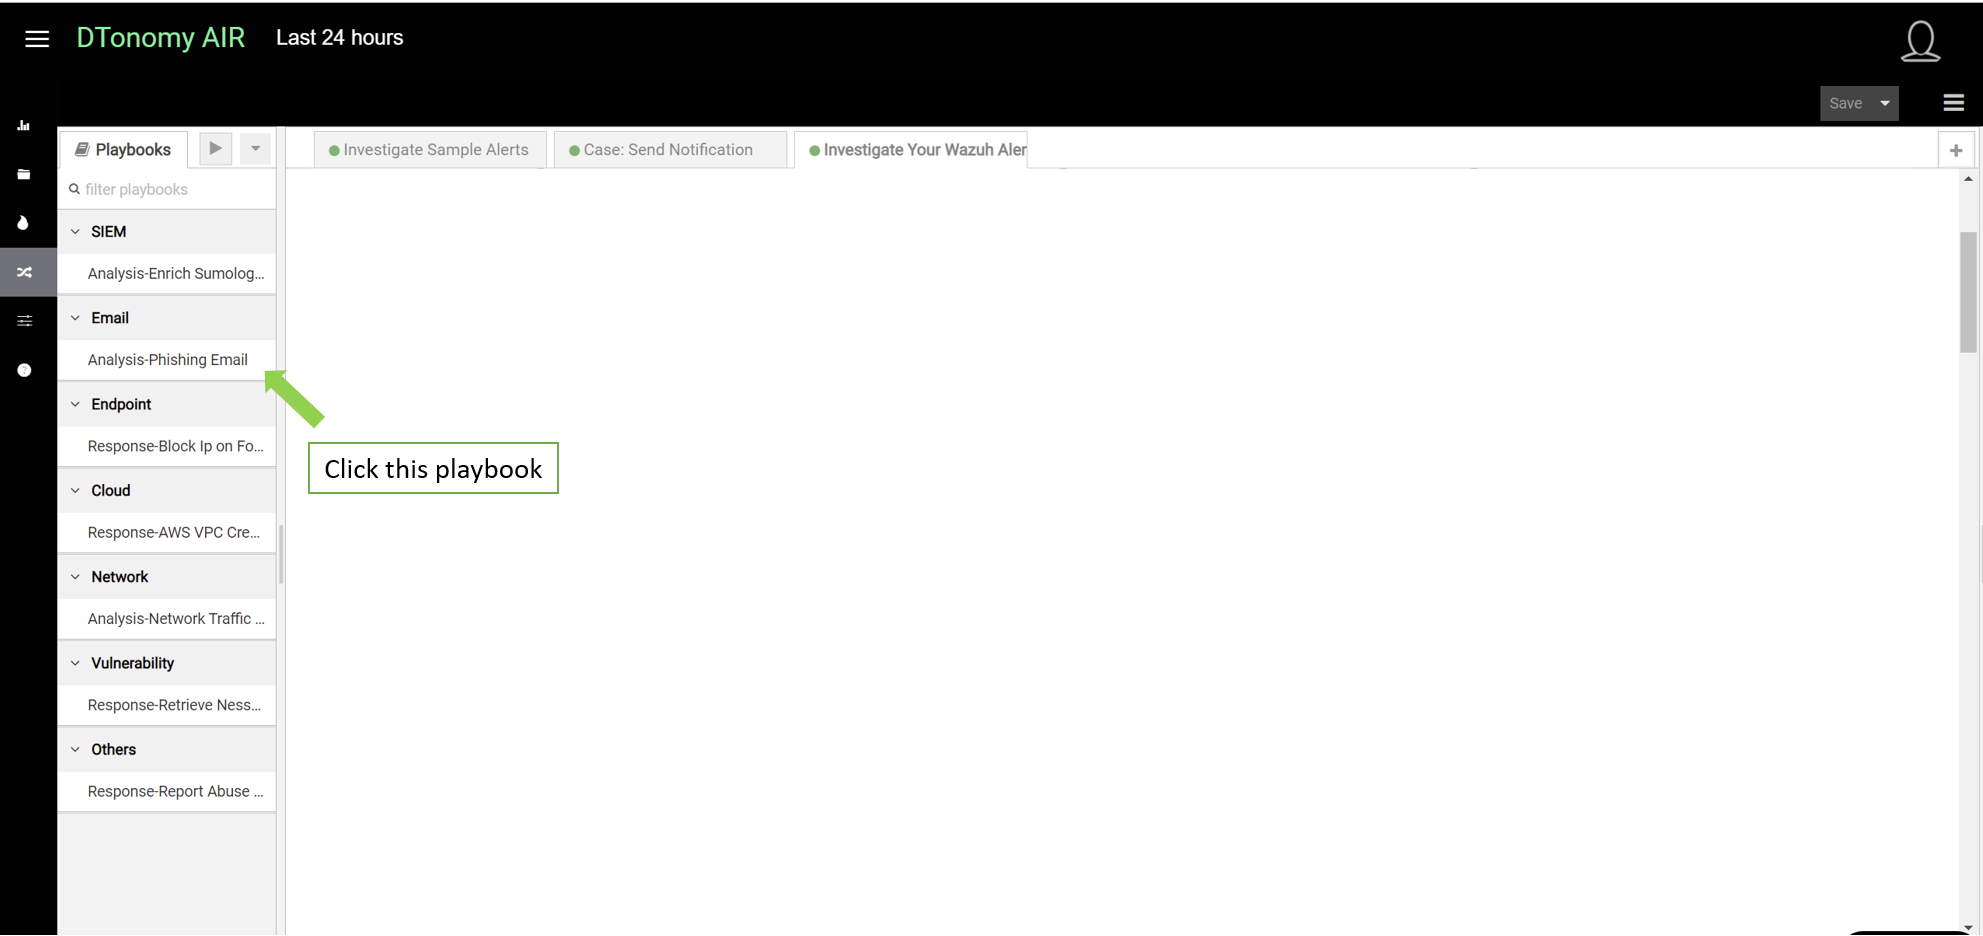
It will show up on workflow editor on the right side as showing below.
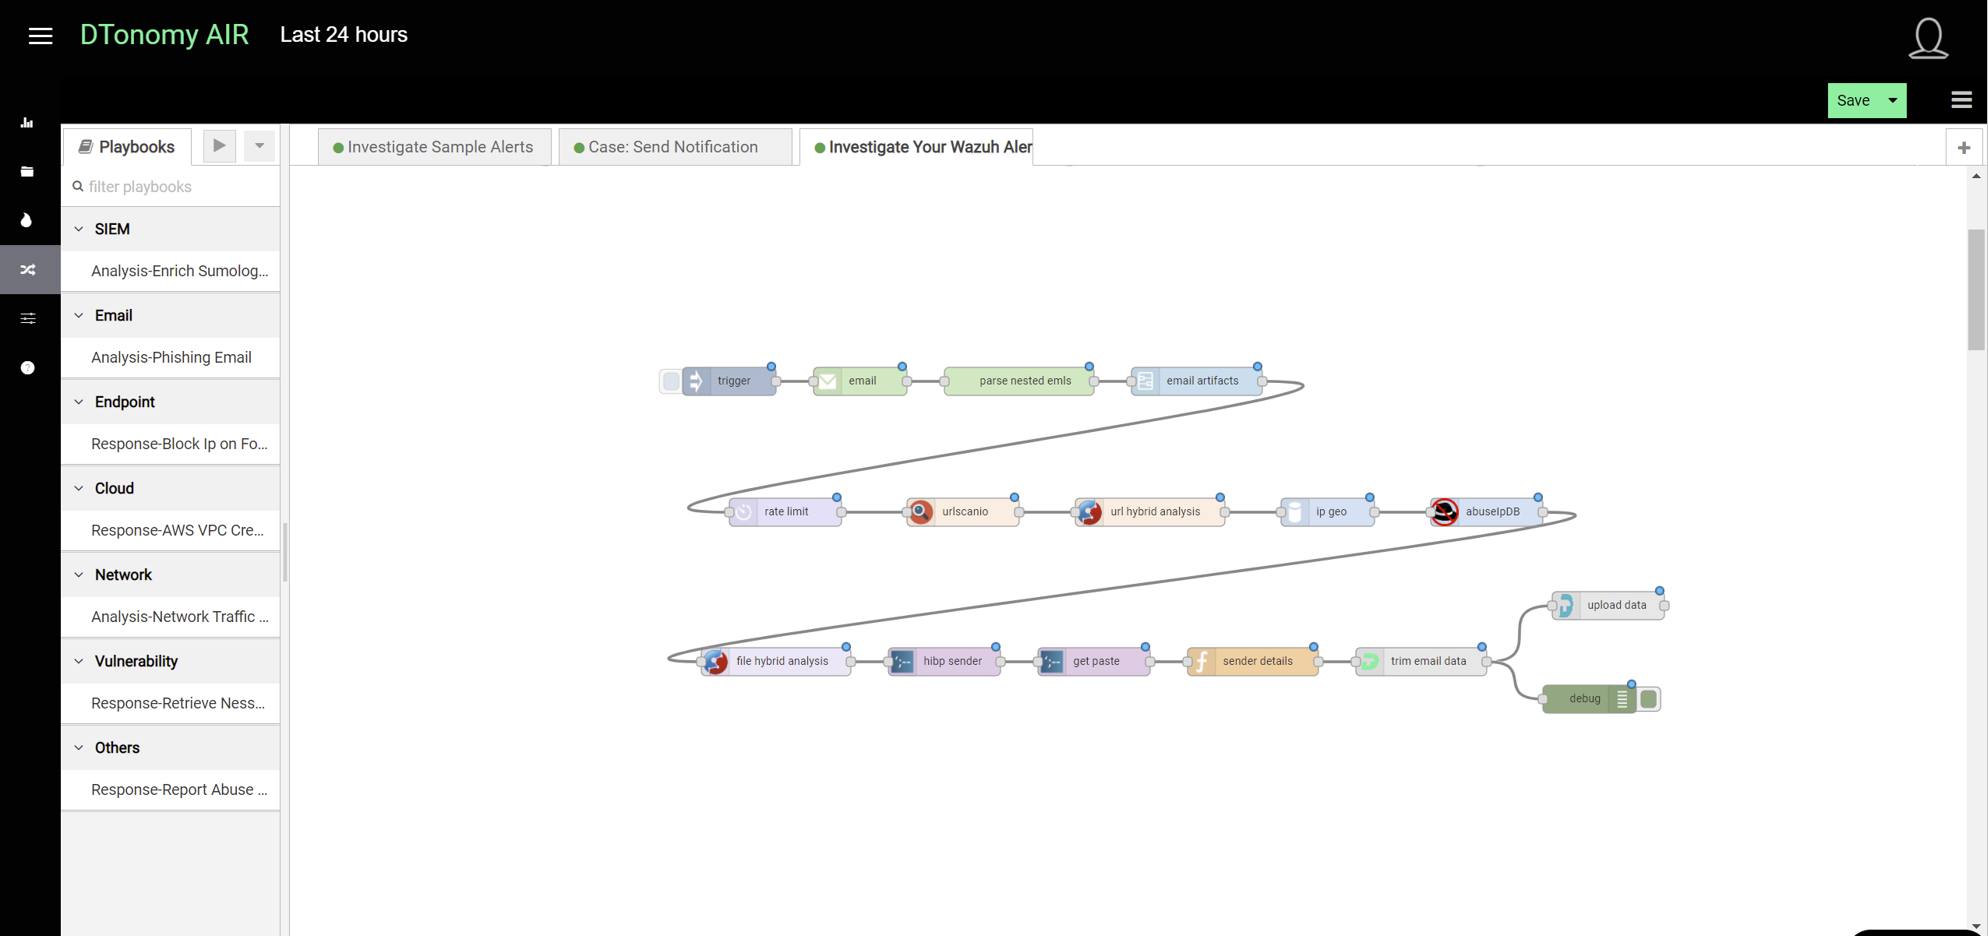
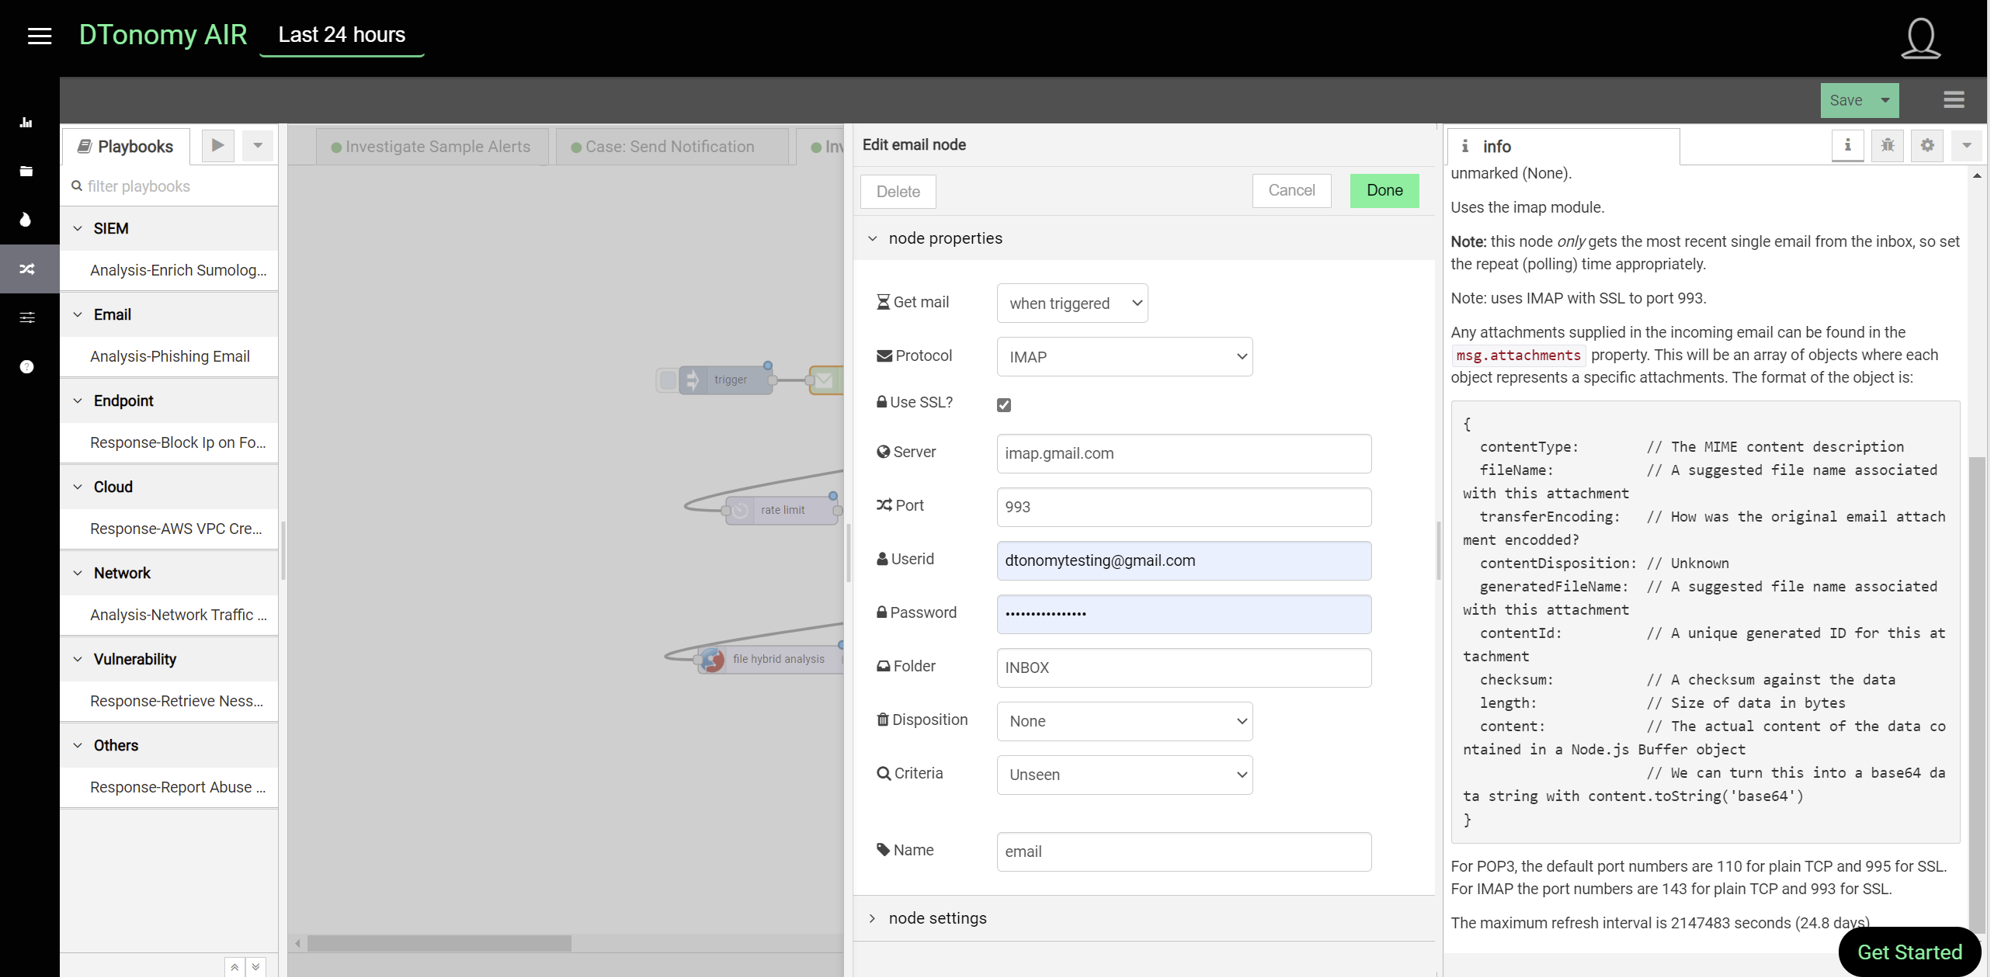
- To enable it to retrieve your email, double click email node to open up the configuration window.
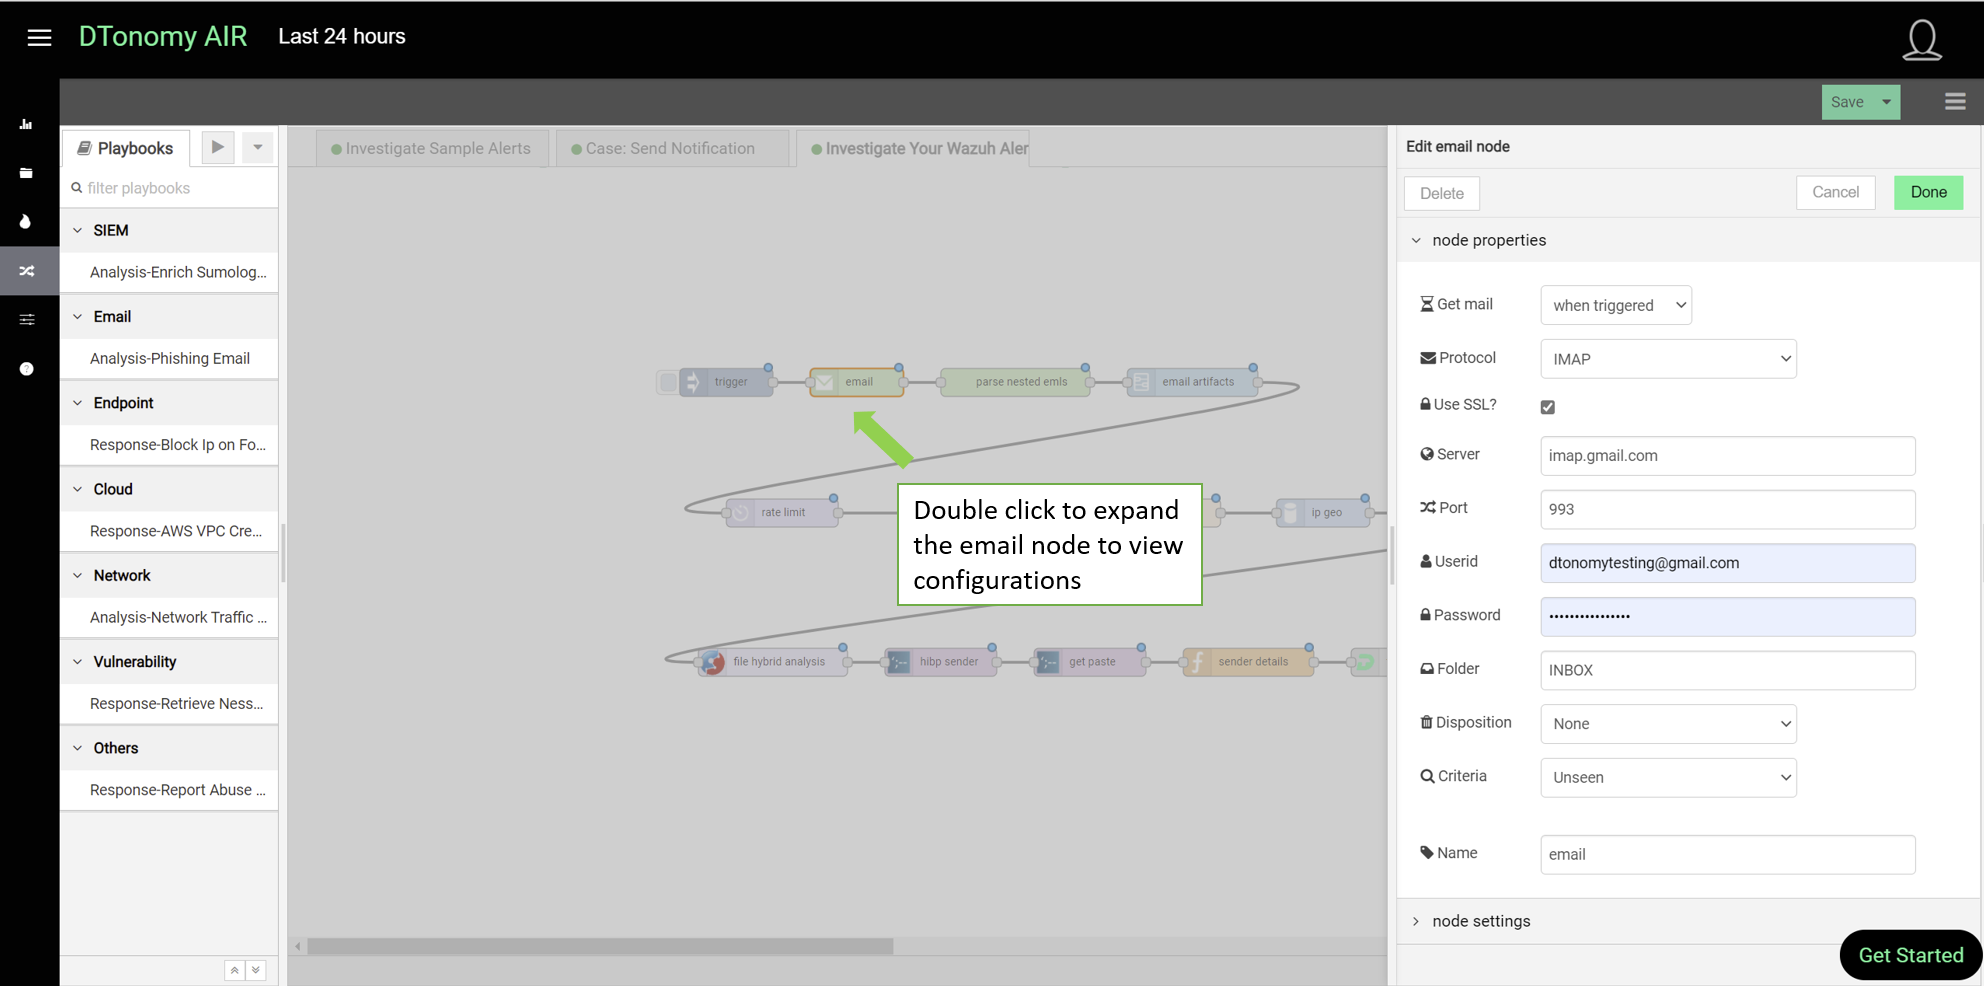
Fill in userid and password of your email box. For GSuite managed email account, you will need to use App Passwords (instruction).
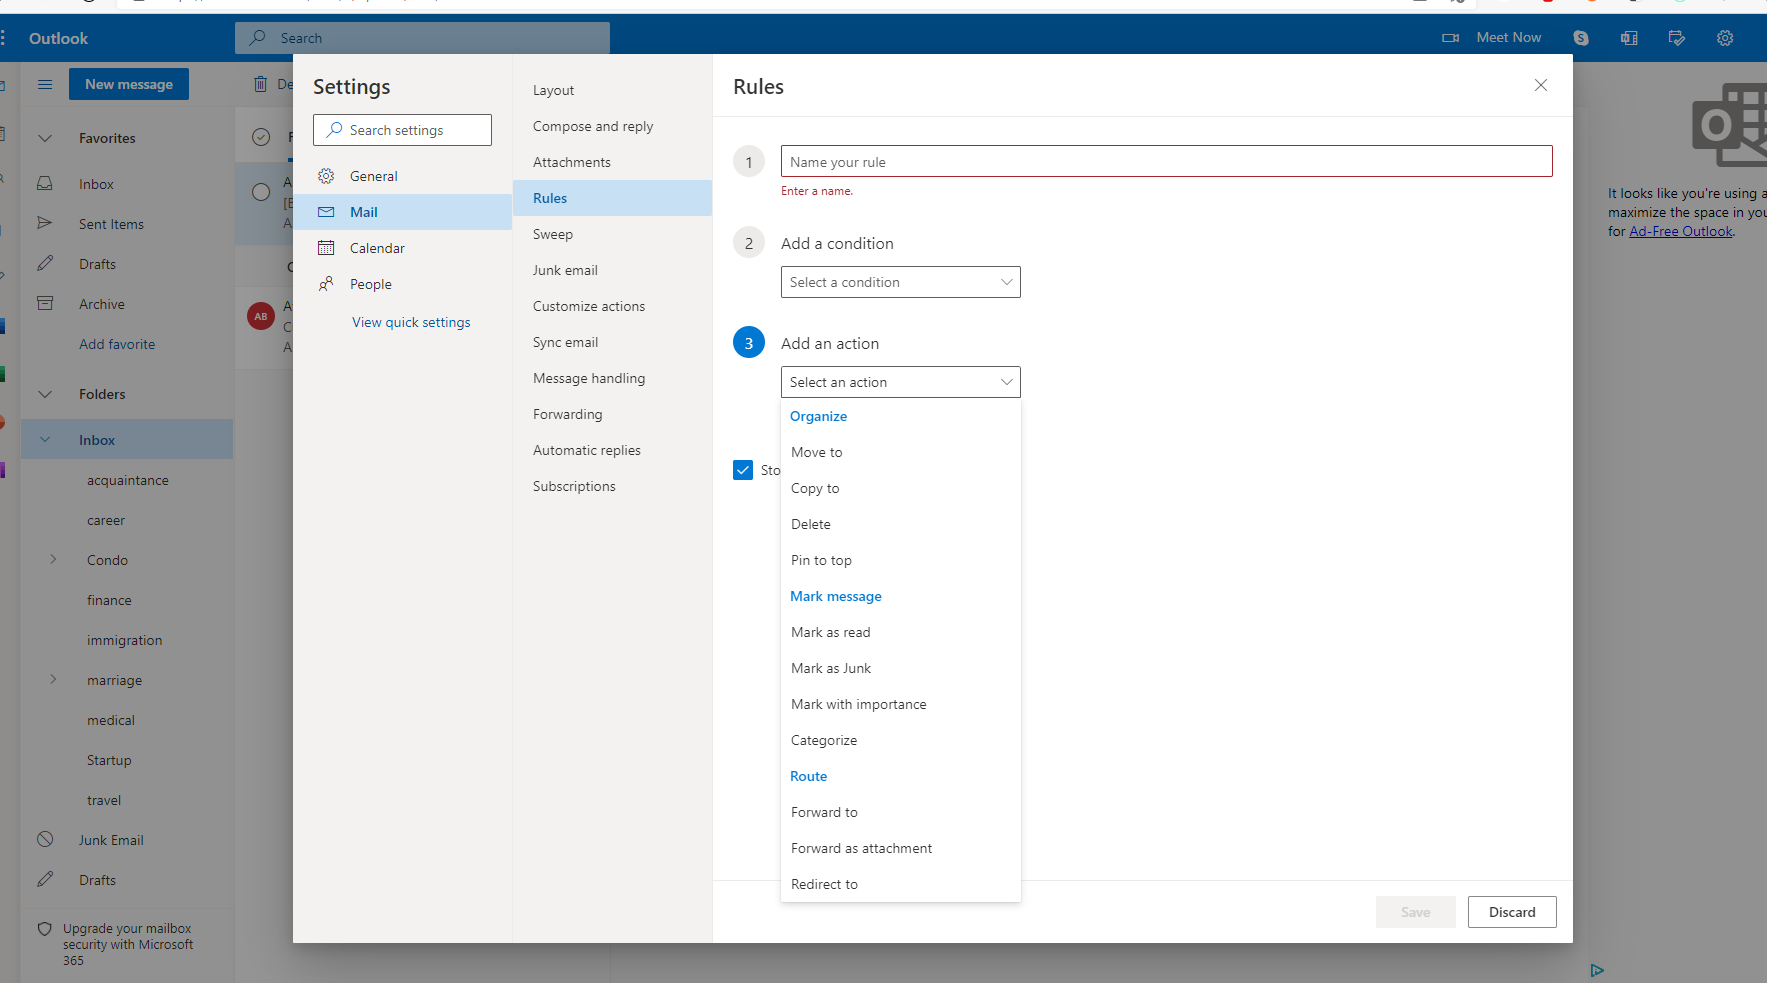
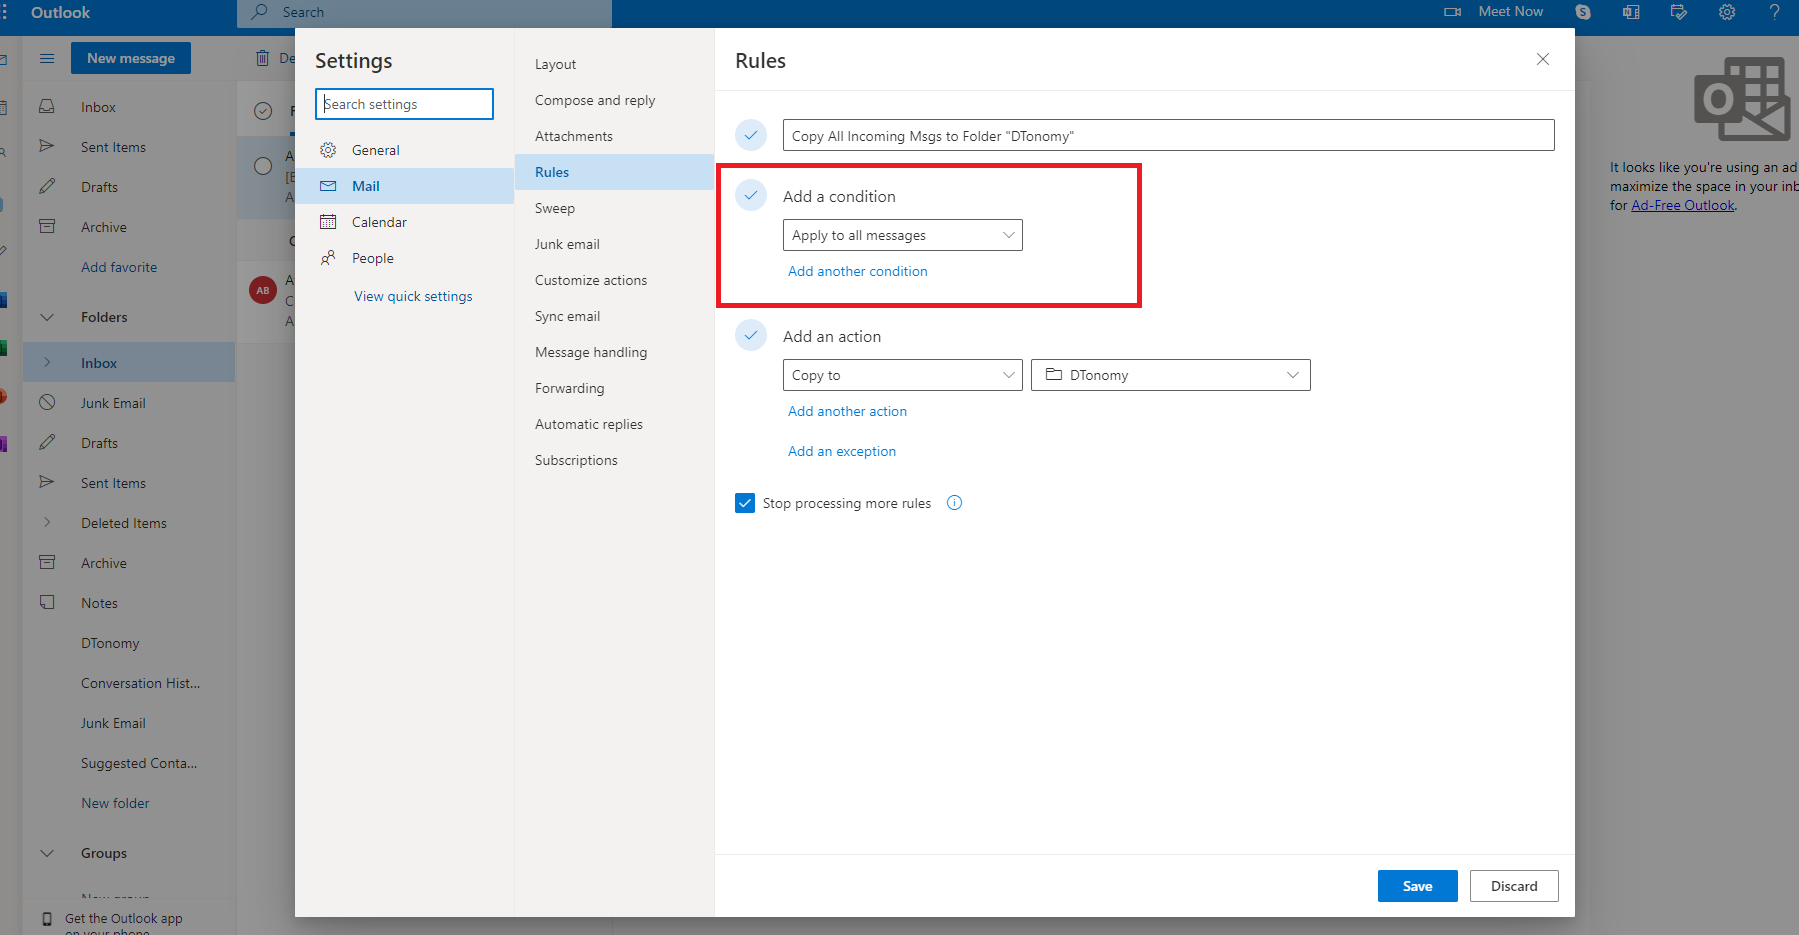
Configuration for your email inbox: To avoid polluting your current inbox and enable DTonomy to continuously analyze your incoming emails, we strongly advise putting all emails you’d like to analyze into a separate folder - DTonomy. You can achieve this by creating a rule in your email inbox to save a copy of emails to DTonomy folder. Here is an example in outlook.
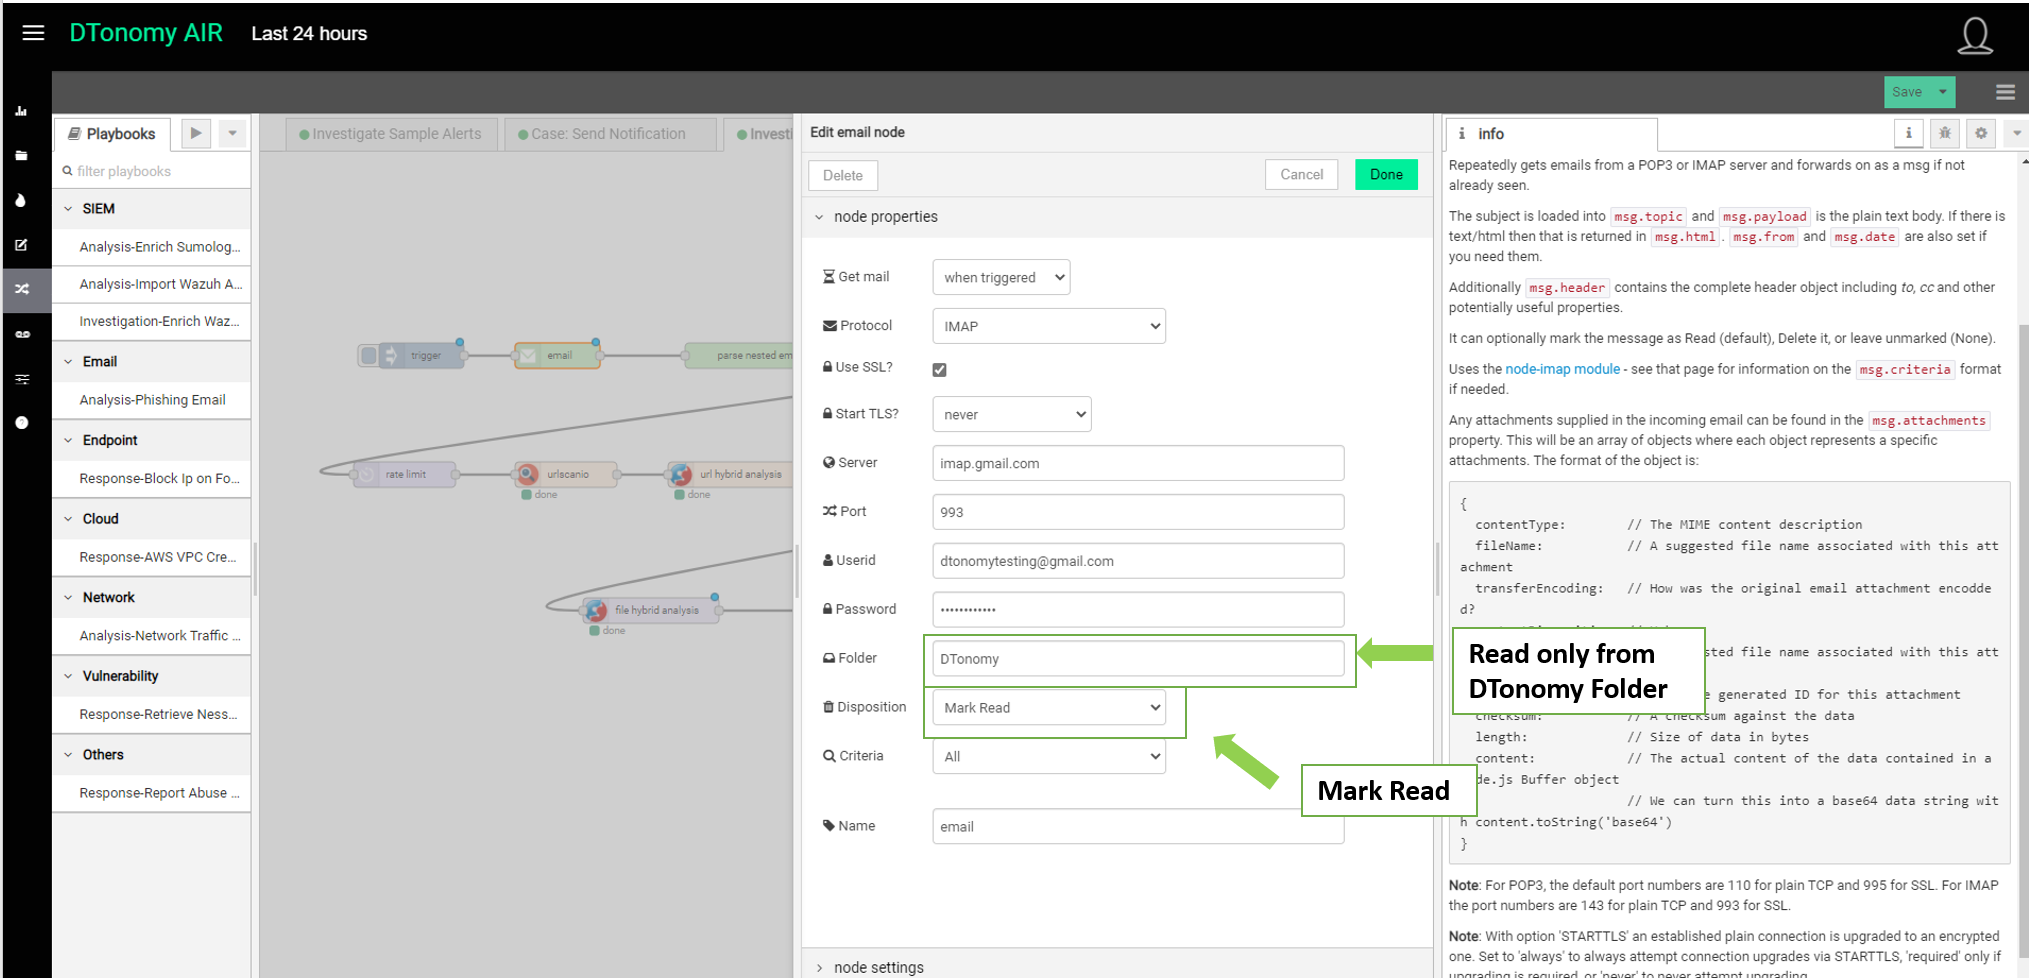
And in the email node, set Folder to DTonomy and Disposition to Mark Read
- Mouse over to the right, you can see the helper on how to configure each node.
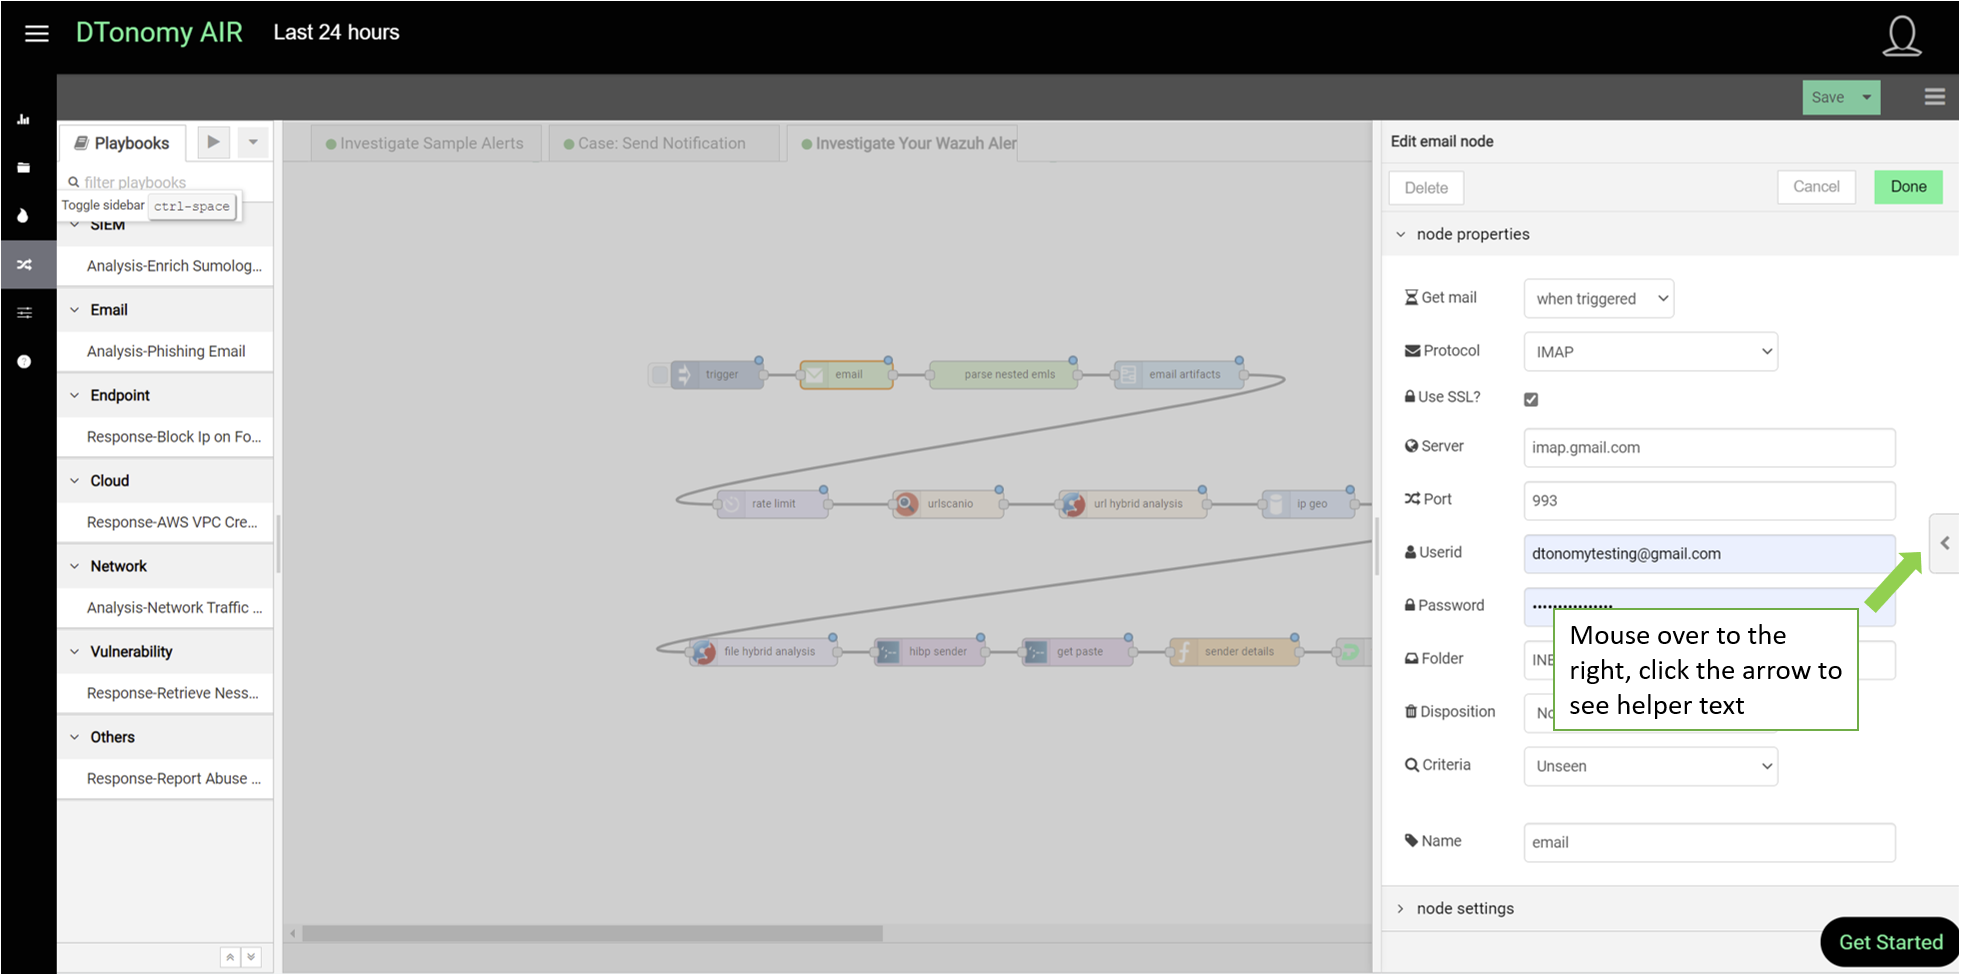
Here is the information panel for email node.
- Click Save button to deploy workflow.
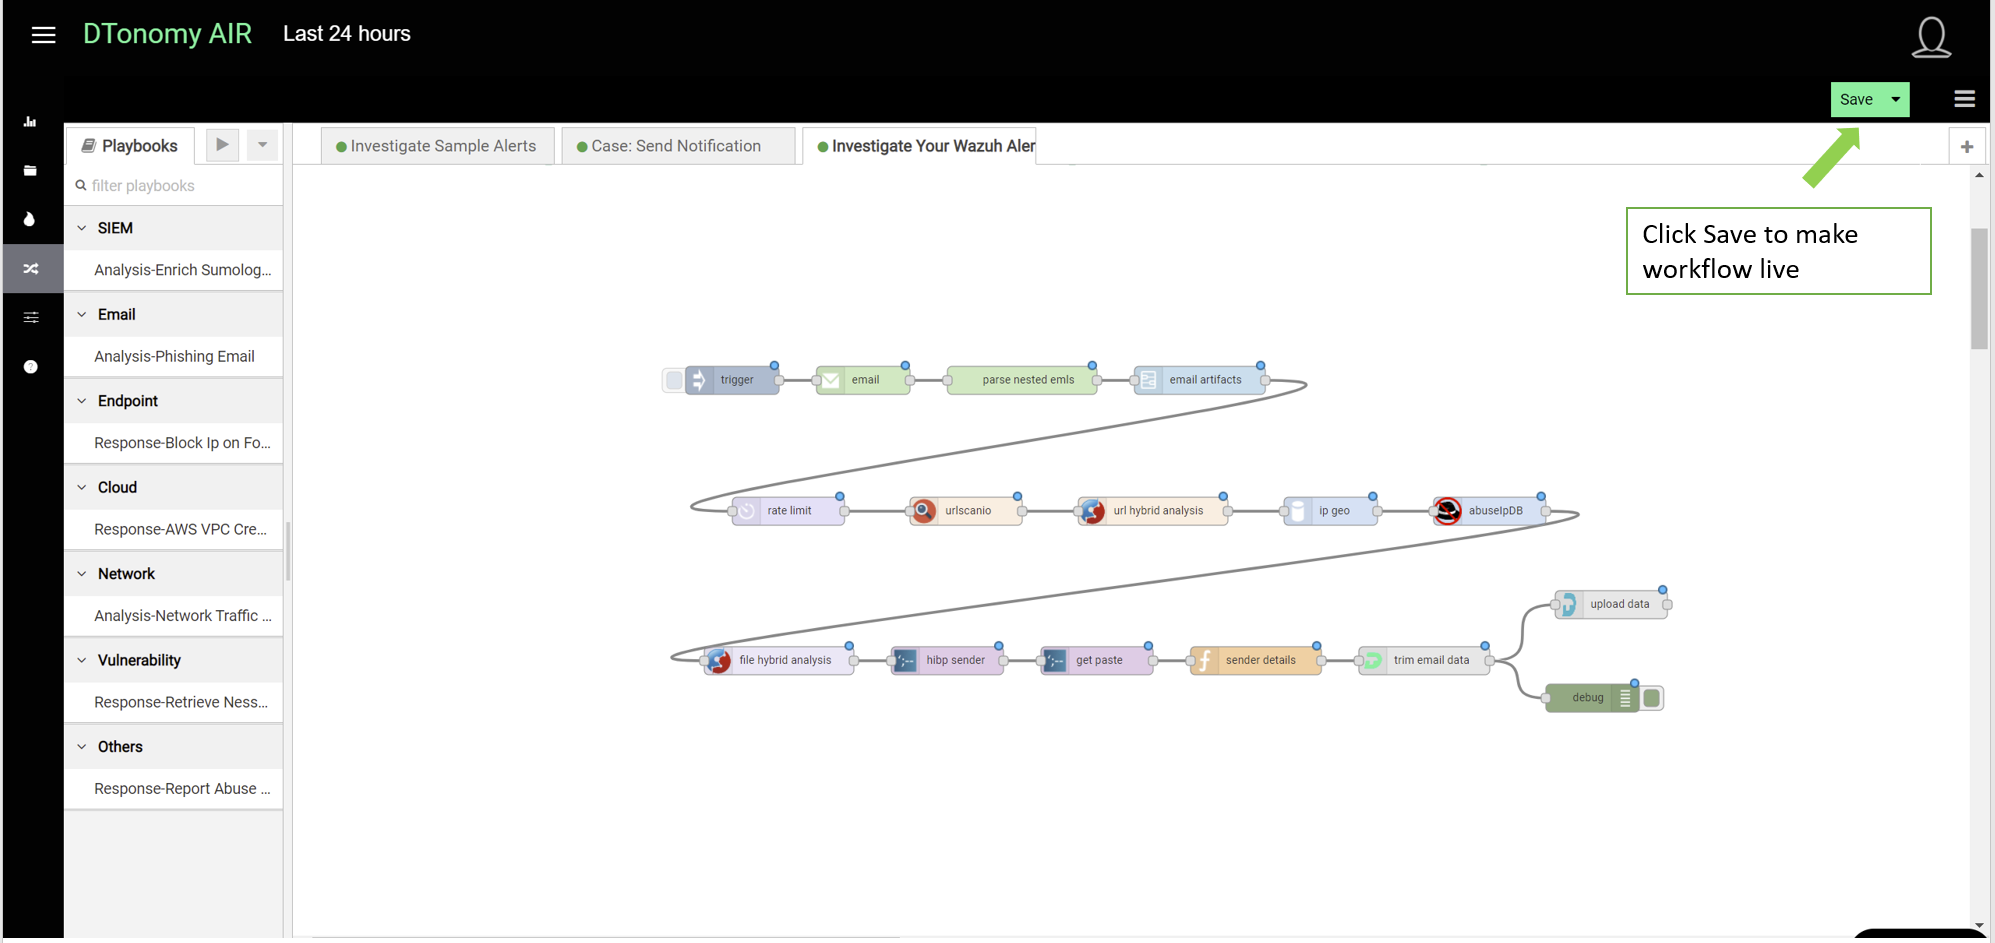
Once saved, it will be live in the background.
- Click arrow on the left to run the workflow.
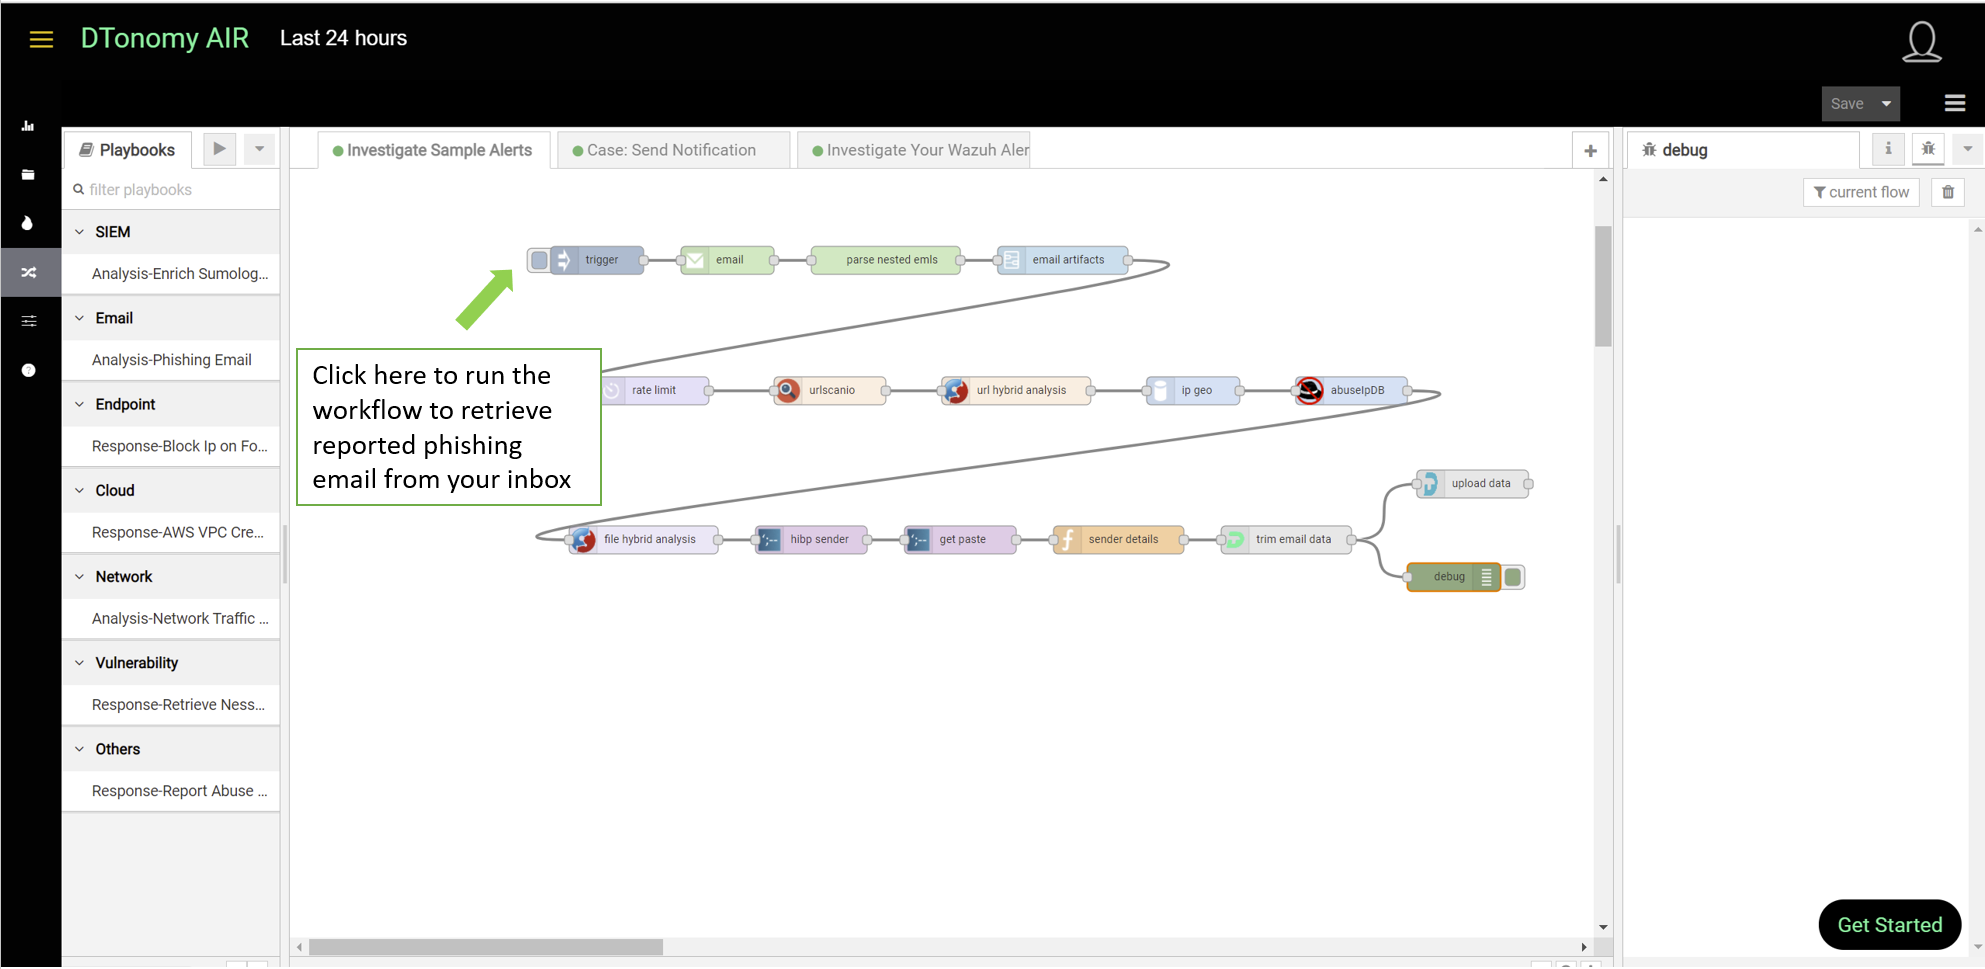
The workflow automatically retrieves new unseen email from your inbox. It then automatically parses email entities, correlates with other threat intelligence and eventually uploads all information to DTonomy server. Depends on the number of email, it may take a couple of minutes to finish all the automated steps.
- After upload, you can view phishing alerts on Alerts menu.
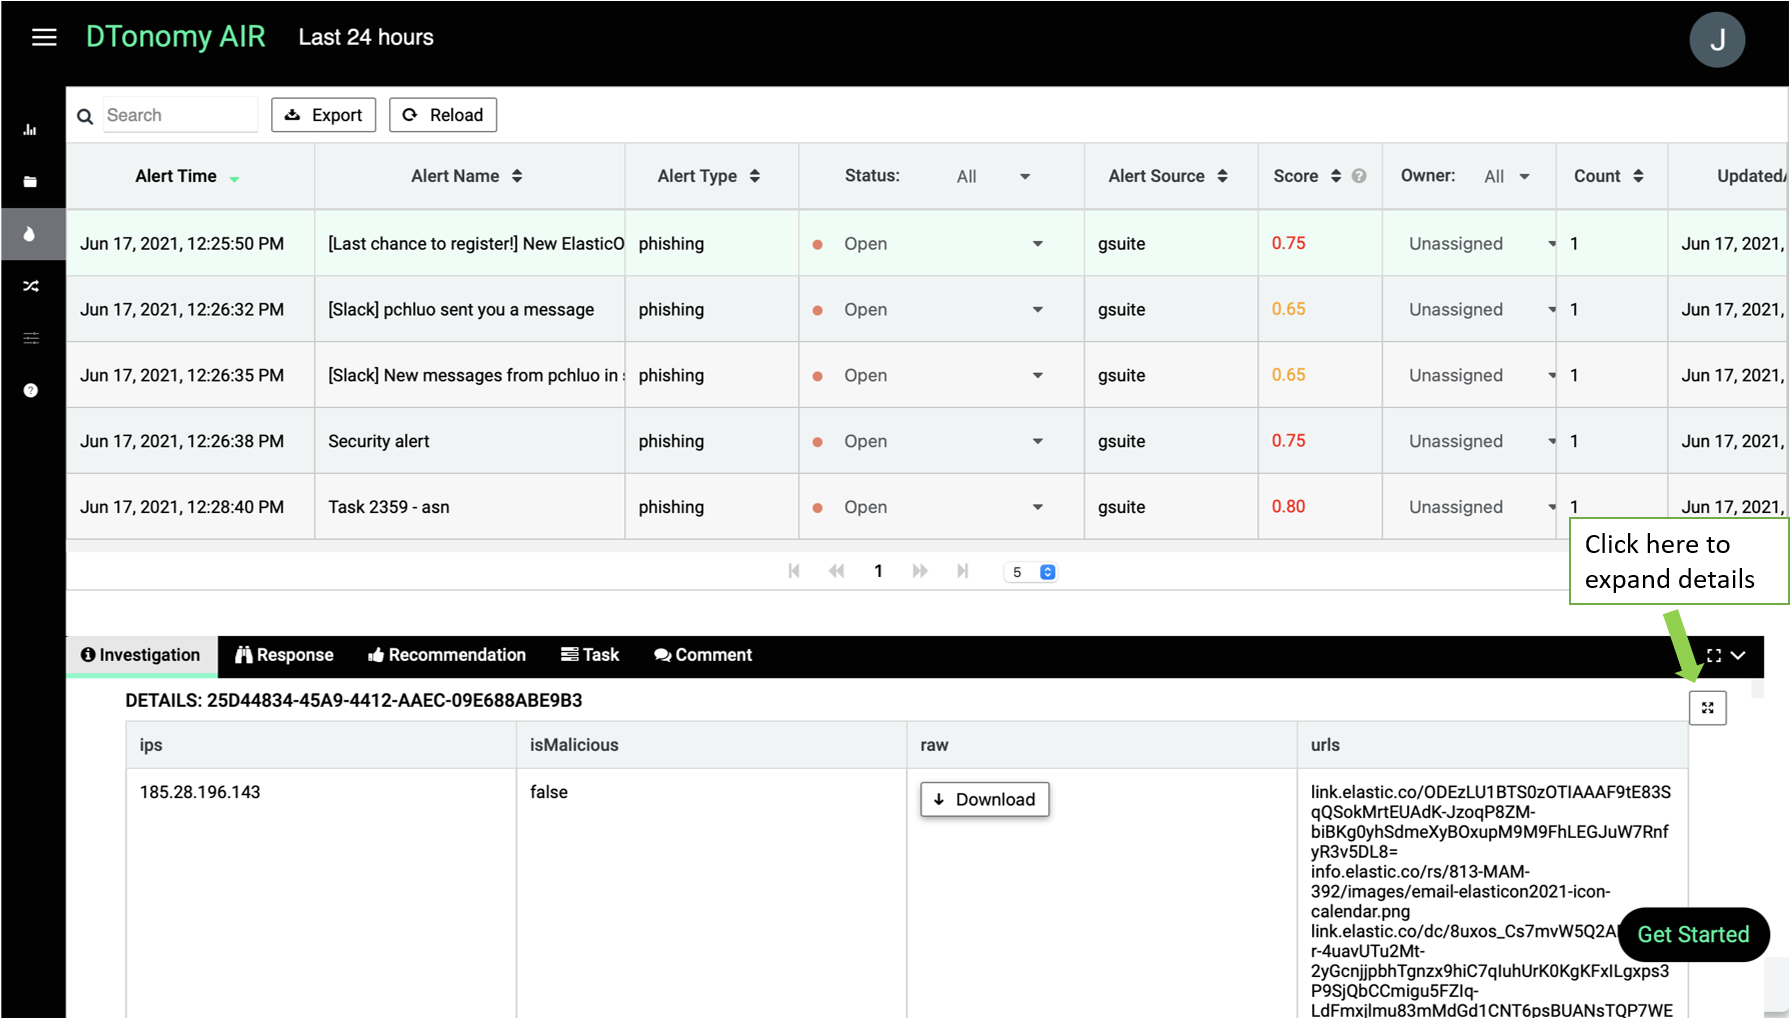
Once you select a alert, you can view relevant alert details. Click the expand icon on the lower bottom details panel, you can start to view the details of alerts.
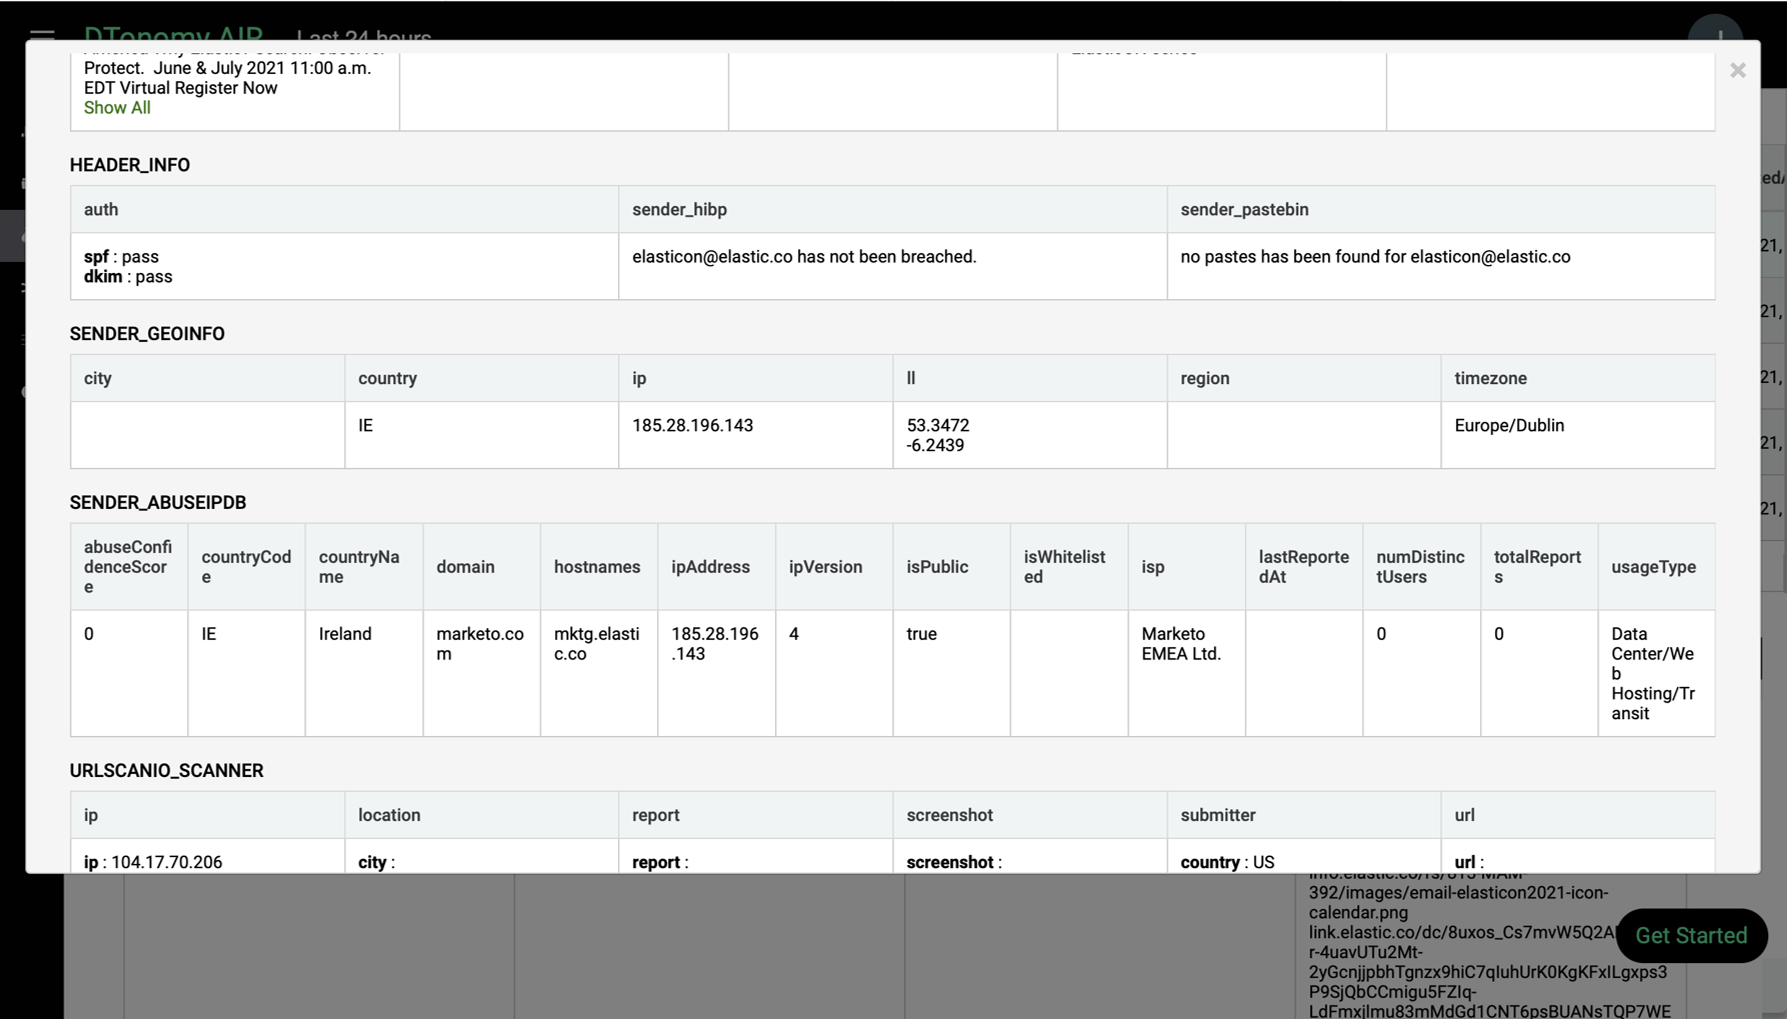
Click response tab, you can select workflow to take actions in response to alerts.
SIEM Alerts Analysis
DTonomy Professional Version enables teams to process large amount of alerts with automation and advanced AI assistant. This tutorial walks you thru the steps required start using DTonomy AIR with security detections from Elastic SIEM:
- Configuring DTonomy to get detections from Elastic SIEM for analysis.
- Discovering patterns amongst Elastic SIEM detections and managing cases.
- Reviewing automatically correlated cases thru visualizations and timelines, as well as automatically generated recommended actions and automated responses.
At the end of this tutorial, you will be able to use DTonomy AIR with your own detections from Elastic SIEM.
Summary
- In the Integration step, we will configure how DTonomy to get detections from Elastic SIEM and then run this configuration to initiate DTonomy’s continuously receiving new Elastic SIEM detections. Step 1 is a one-time setup effort that does not need to be repeated once completed.
- In the Pattern Discovery step, we will setup DTonomy AI-based Patterns to automatically cross-correlate detections from Elastic SIEM into what are called Cases in DTonomy. DTonomy enables a number of different Patterns which can be used. In this quick start guide, we will setup the most commonly used Pattern called InterconnectedAlerts.
- In the Decision and Response step, once DTonomy has automatically created Cases, you will be able to start viewing DTonomy’s automatically generated Timelines and Visualizations, as well as review its automatically generated Recommended Actions and initiate Automated Responses.
Before we jump into steps, let’s first take a look at the architecture.
Step 1: Integration
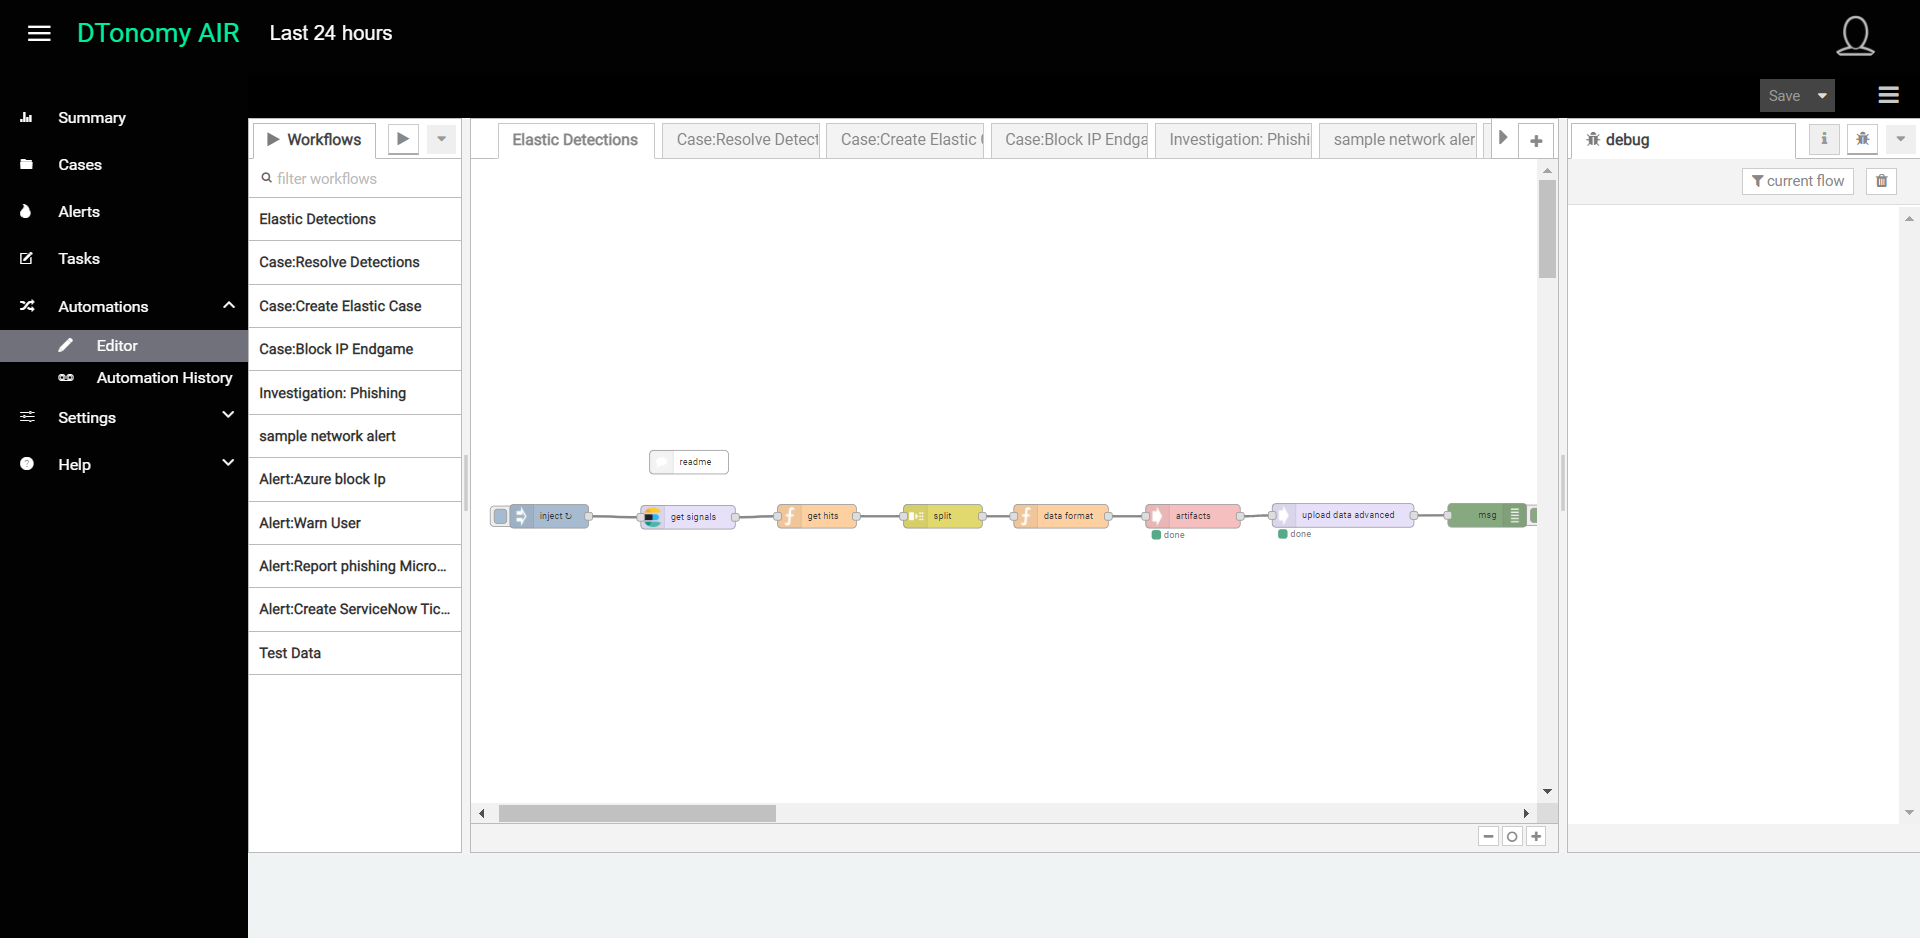
In this first step, we will use a DTonomy Automation to both configure and run the one-time integration of Elastic SIEM detections, as well as prepare this data for DTonomy’s automated pattern discovery. This is made easier through the use of a pre-defined Automation workflow.
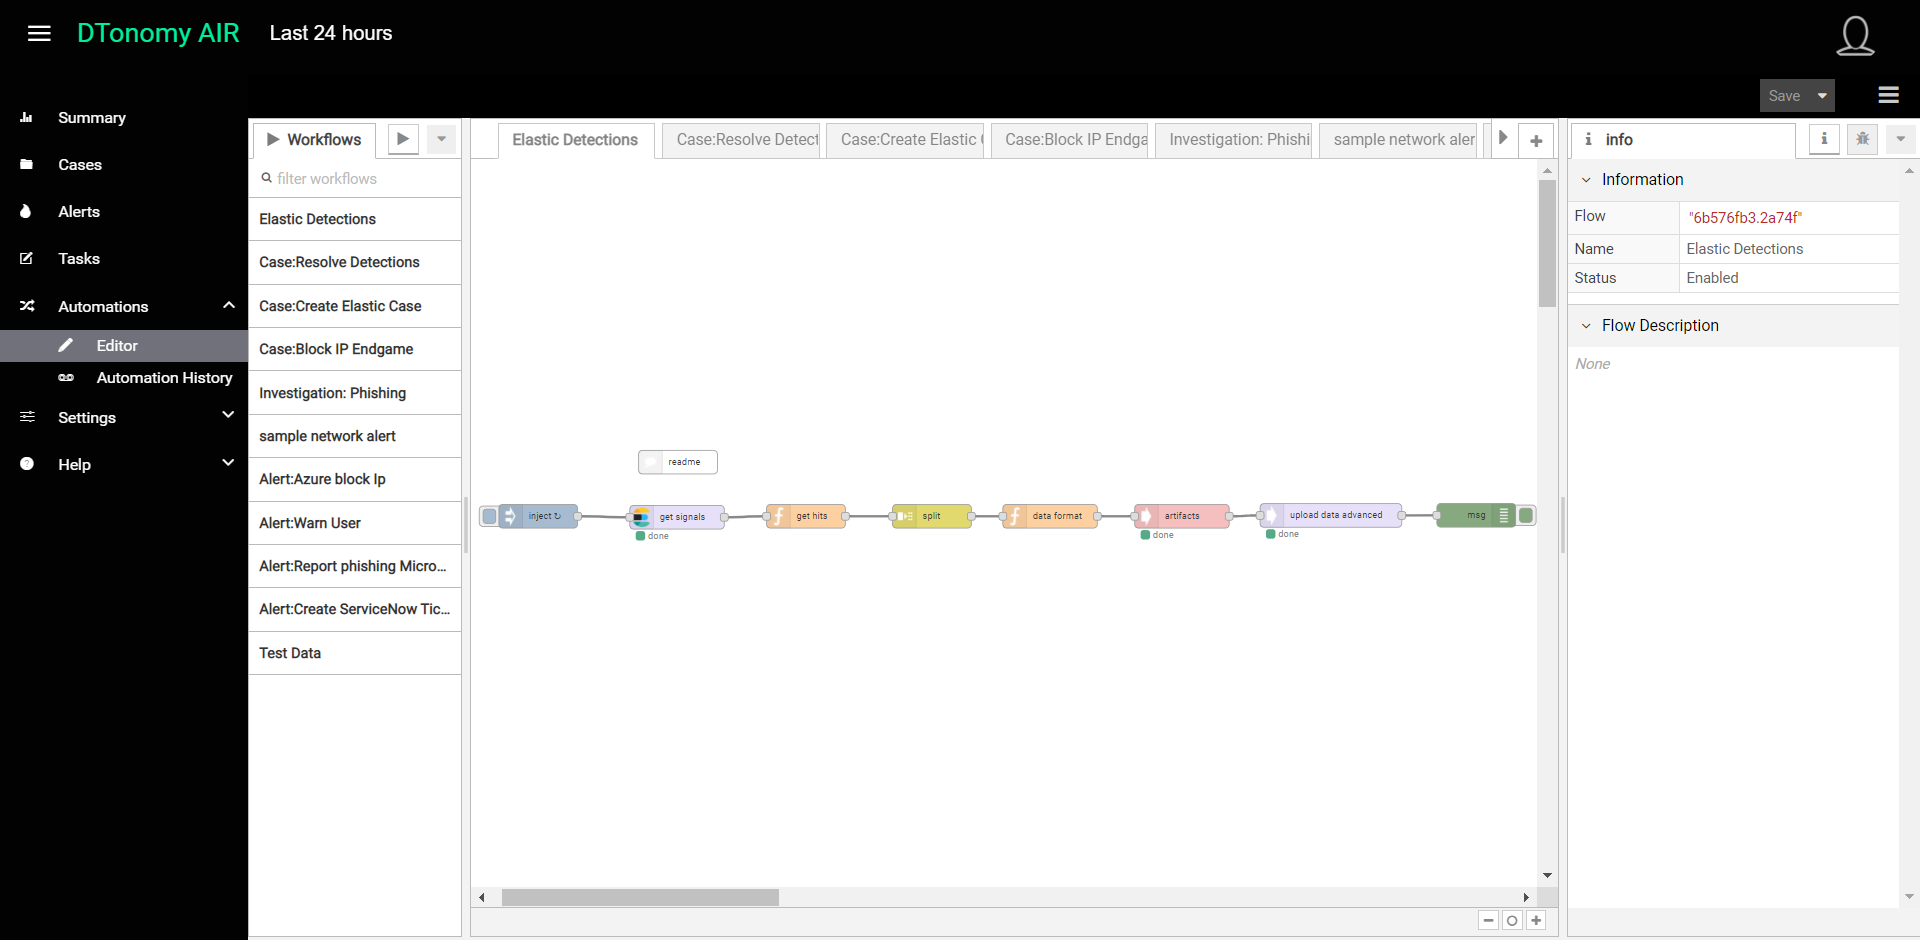
- Once in the Automation Editor, find the “Elastic Detection” workflow and select it so that it shows up on the Automation canvas. You can think of this DTonomy workflow as a data pipeline for Elastic SIEM data ingestion.
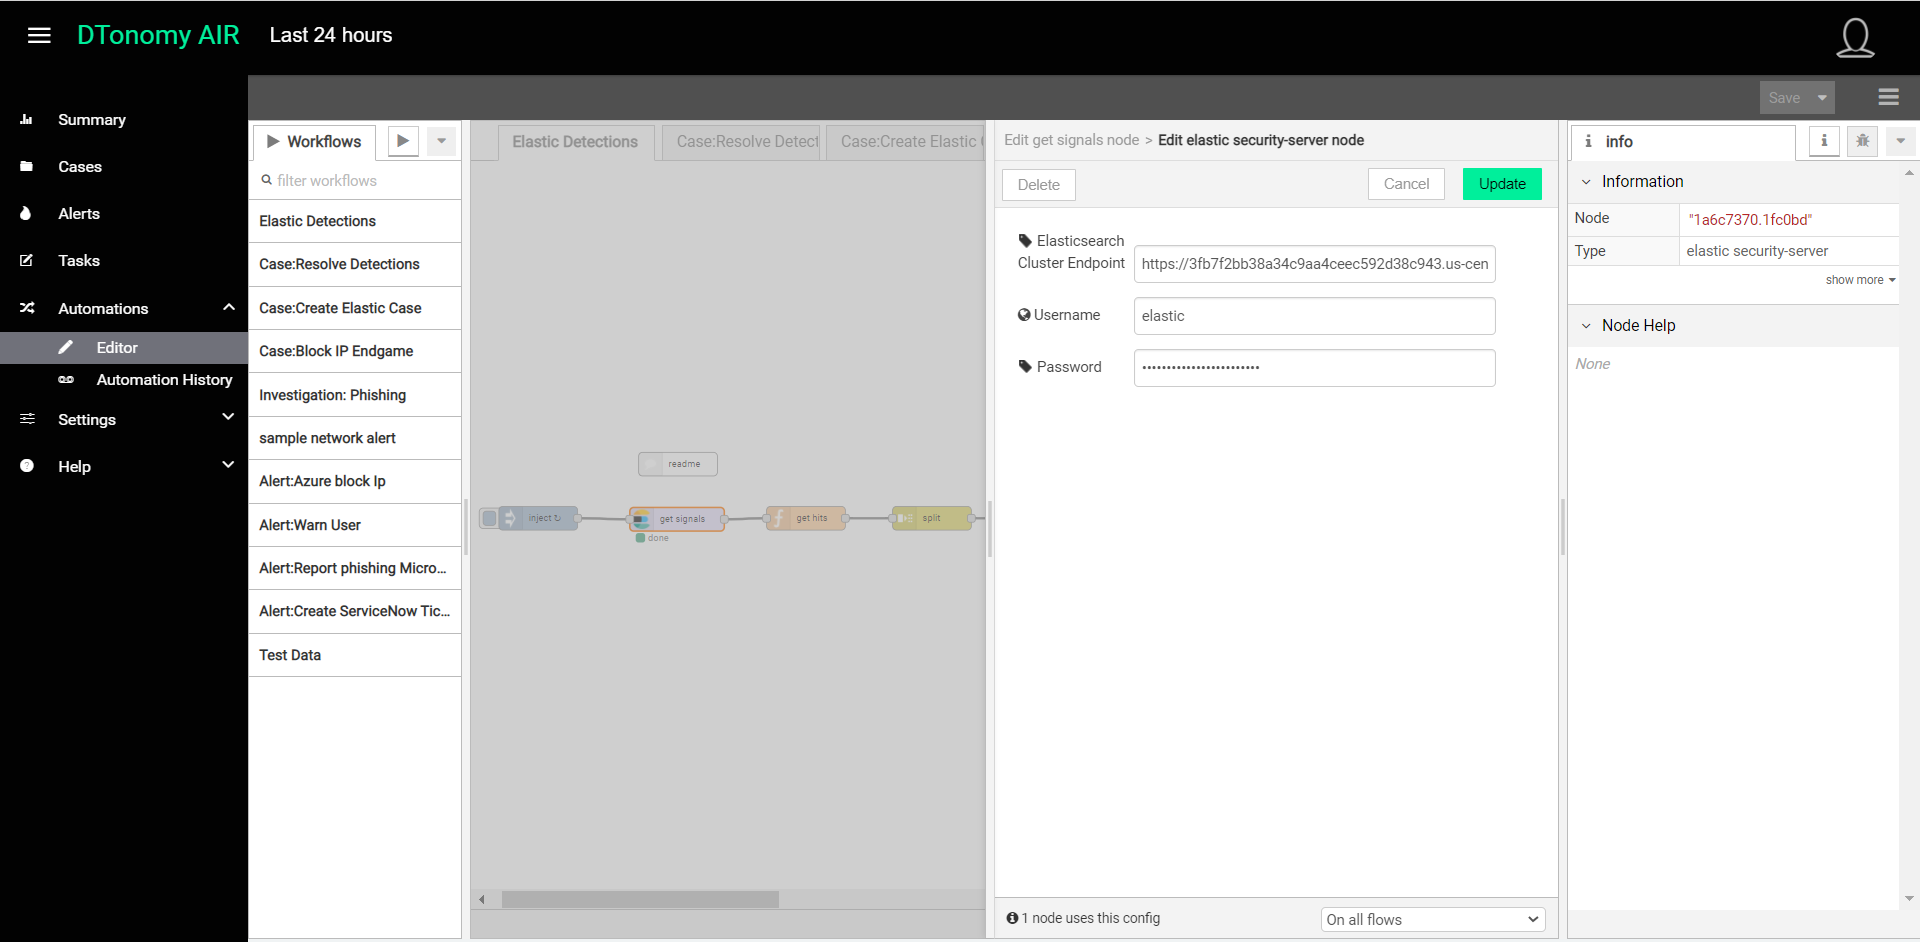
- We now need to configure the steps in this data pipeline. First, we will configure the connection to Elasticsearch by selecting the Elastic-security-server node in this predefined workflow, double-clicking it and entering the URL for your Elasticsearch Cluster, as well as the username and password that will be used to gain access to obtain Elastic SIEM detections.
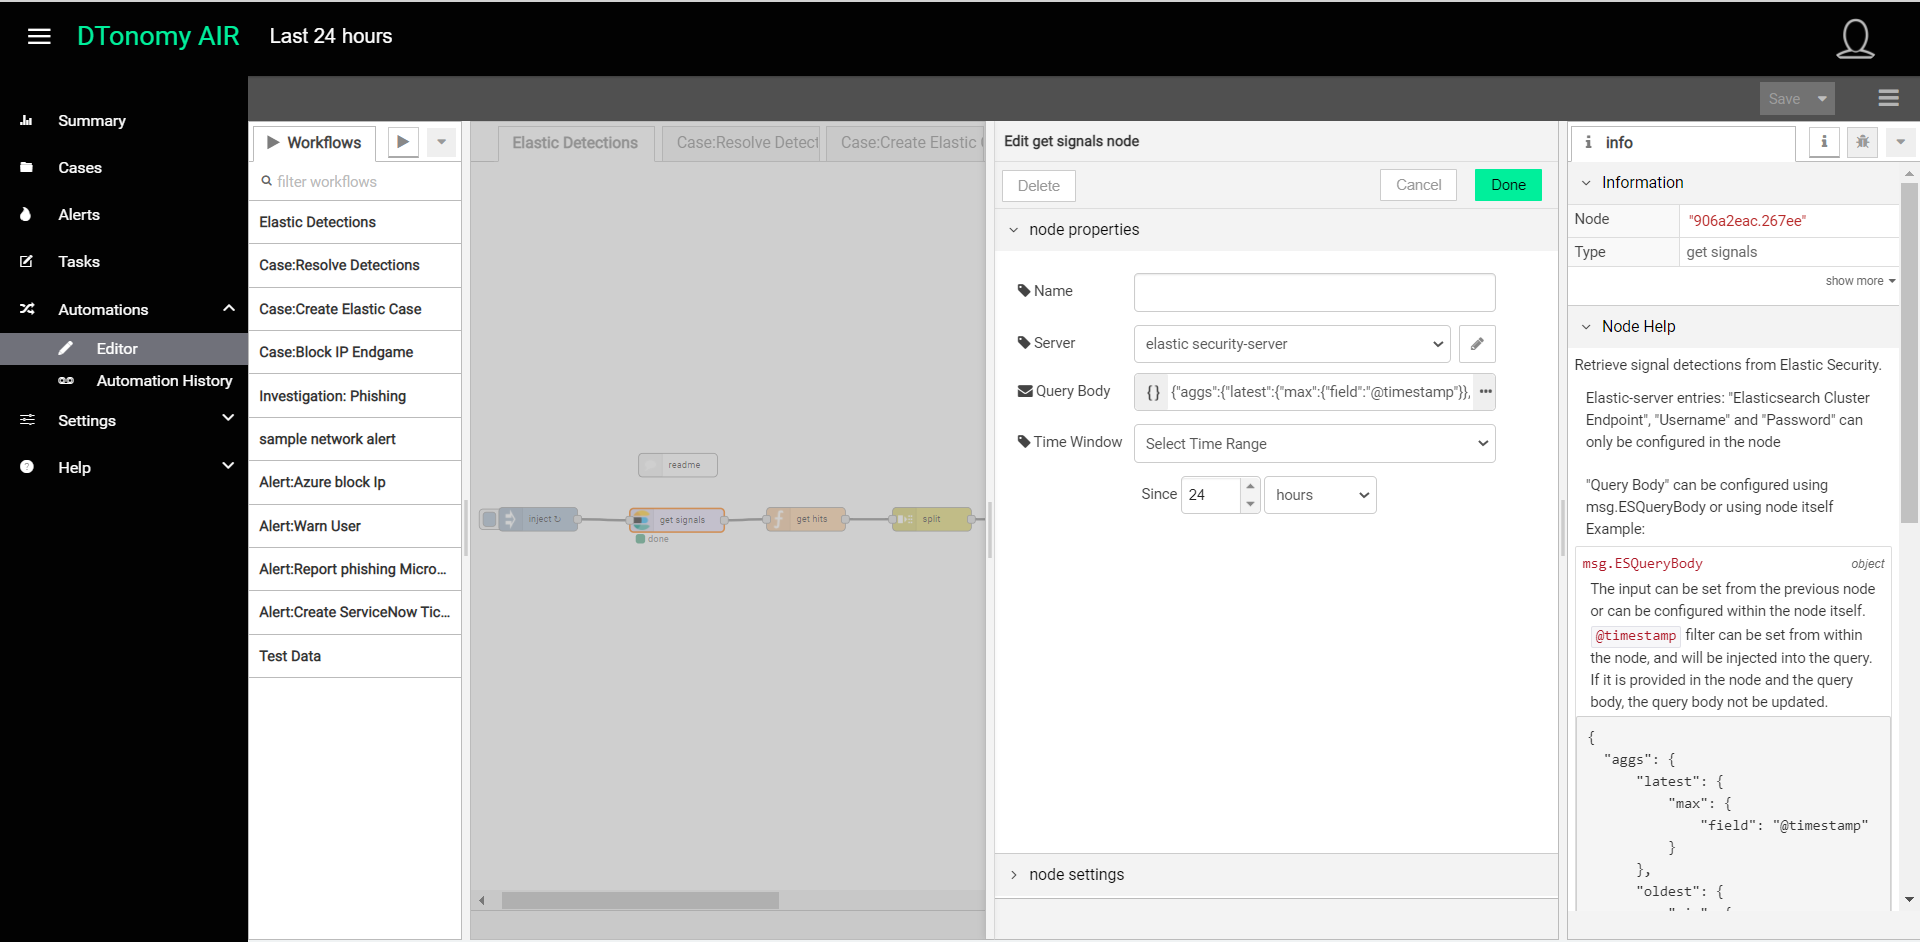
- Next, we want to configure the refresh time window for DTonomy so the integration will continuously receive new Elastic SIEM detections. We can do this by selecting the “get signals” node, double-clicking it, and updating its Query Body and Time Window. The Query Body is the query of detections in elastic search. The time window is the duration of detections generated by Elasticsearch that you want to review. Recommended time would be 24 hours which means it would look at the detections in the past 24 hours.
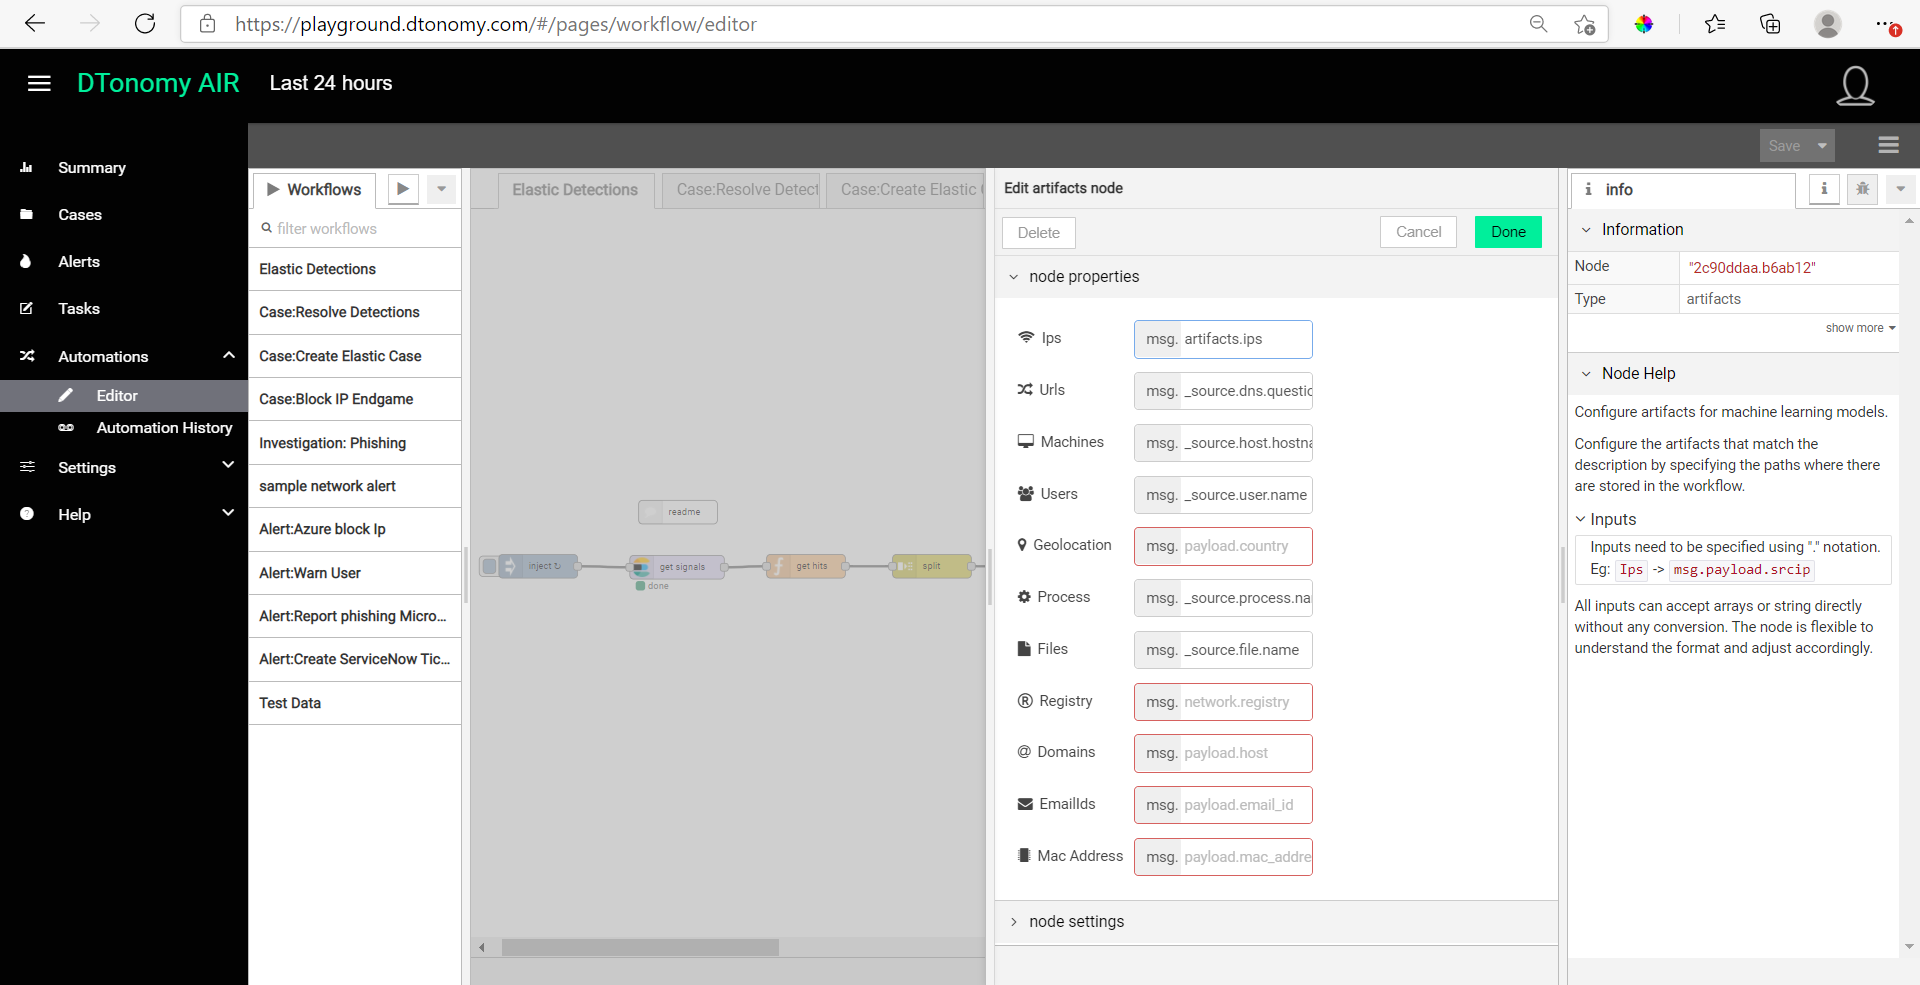
- Lastly, to enable DTonomy’s AI-based pattern discovery, the artifacts (i.e. IP addresses, users, machines) for the newly received Elastic SIEM detections must be mapped to DTonomy artifacts. This mapping is done in the artifacts node, and has been preset with default mapping for Elastic SIEM. Double-clicking the artifacts node to see how the artifacts have already been mapped to the fields in your Elasticsearch detections.
- To complete our one-time configuration, we will run the workflow we’ve created to import data. To do this, click on the trigger on the left side of timestamp node. If you want this workflow to run on a timely manner, then click on repeat and select at interval or specific time. Eg: Every day at 1:00 AM and set the time window in “get signals” node to 24 hours so there are no duplicate detections caused by overlapped time windows.
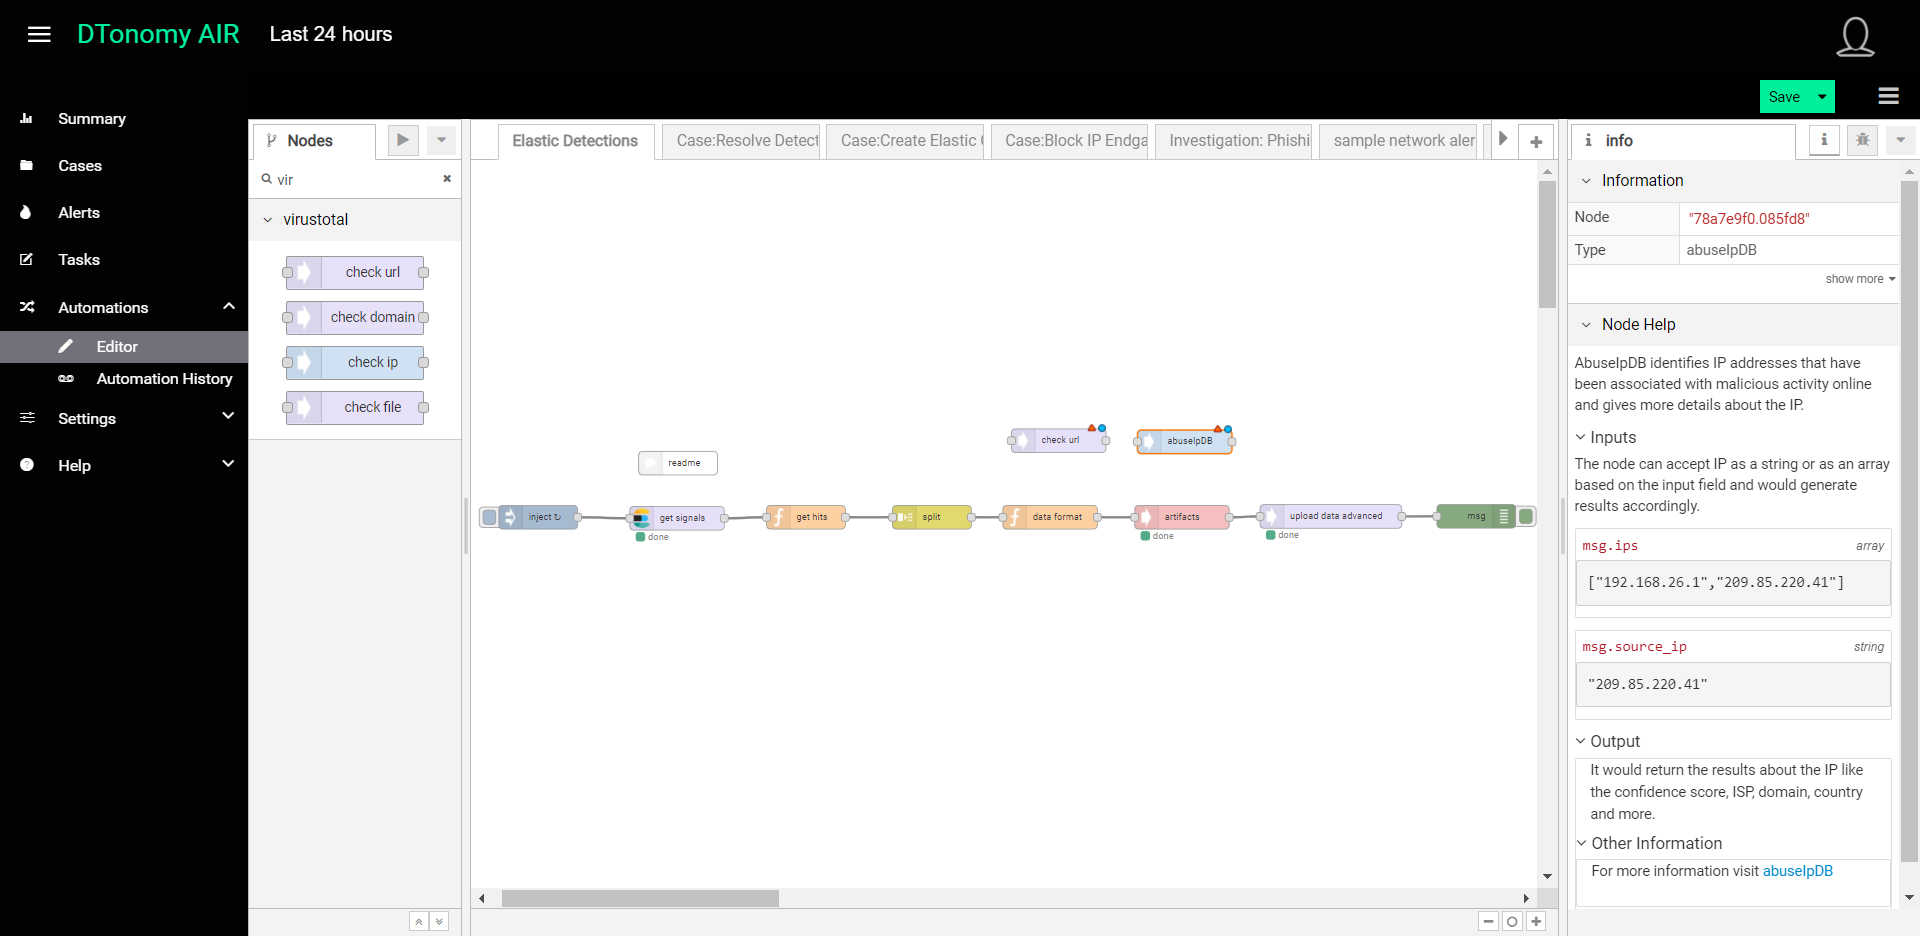
Note: While we’ve now configured DTonomy to leverage Elastic SIEM detections, please note that this workflow we’ve edited can be easily edited to add enrichments, such as VirusTotal or Hybrid Analysis. For instance, you could simply drag a virus total node into the data pipeline to have DTonomy enrich your detections with Virustotal information. While this quick start does not go into full instructions for use of the Automation editor, feel free to refer to document here, play around with it and let us know if you have questions about how to use the editor for any specific use cases you might have in mind.
Step 2: Pattern Discovery
In this step, we will set up DTonomy AI-based Patterns to automatically cross-correlate detections from Elastic SIEM into what are called Cases in DTonomy. DTonomy enables a number of different Patterns which can be used. In this quick start guide, we will set up the most commonly used Pattern called InterconnectedAlerts.
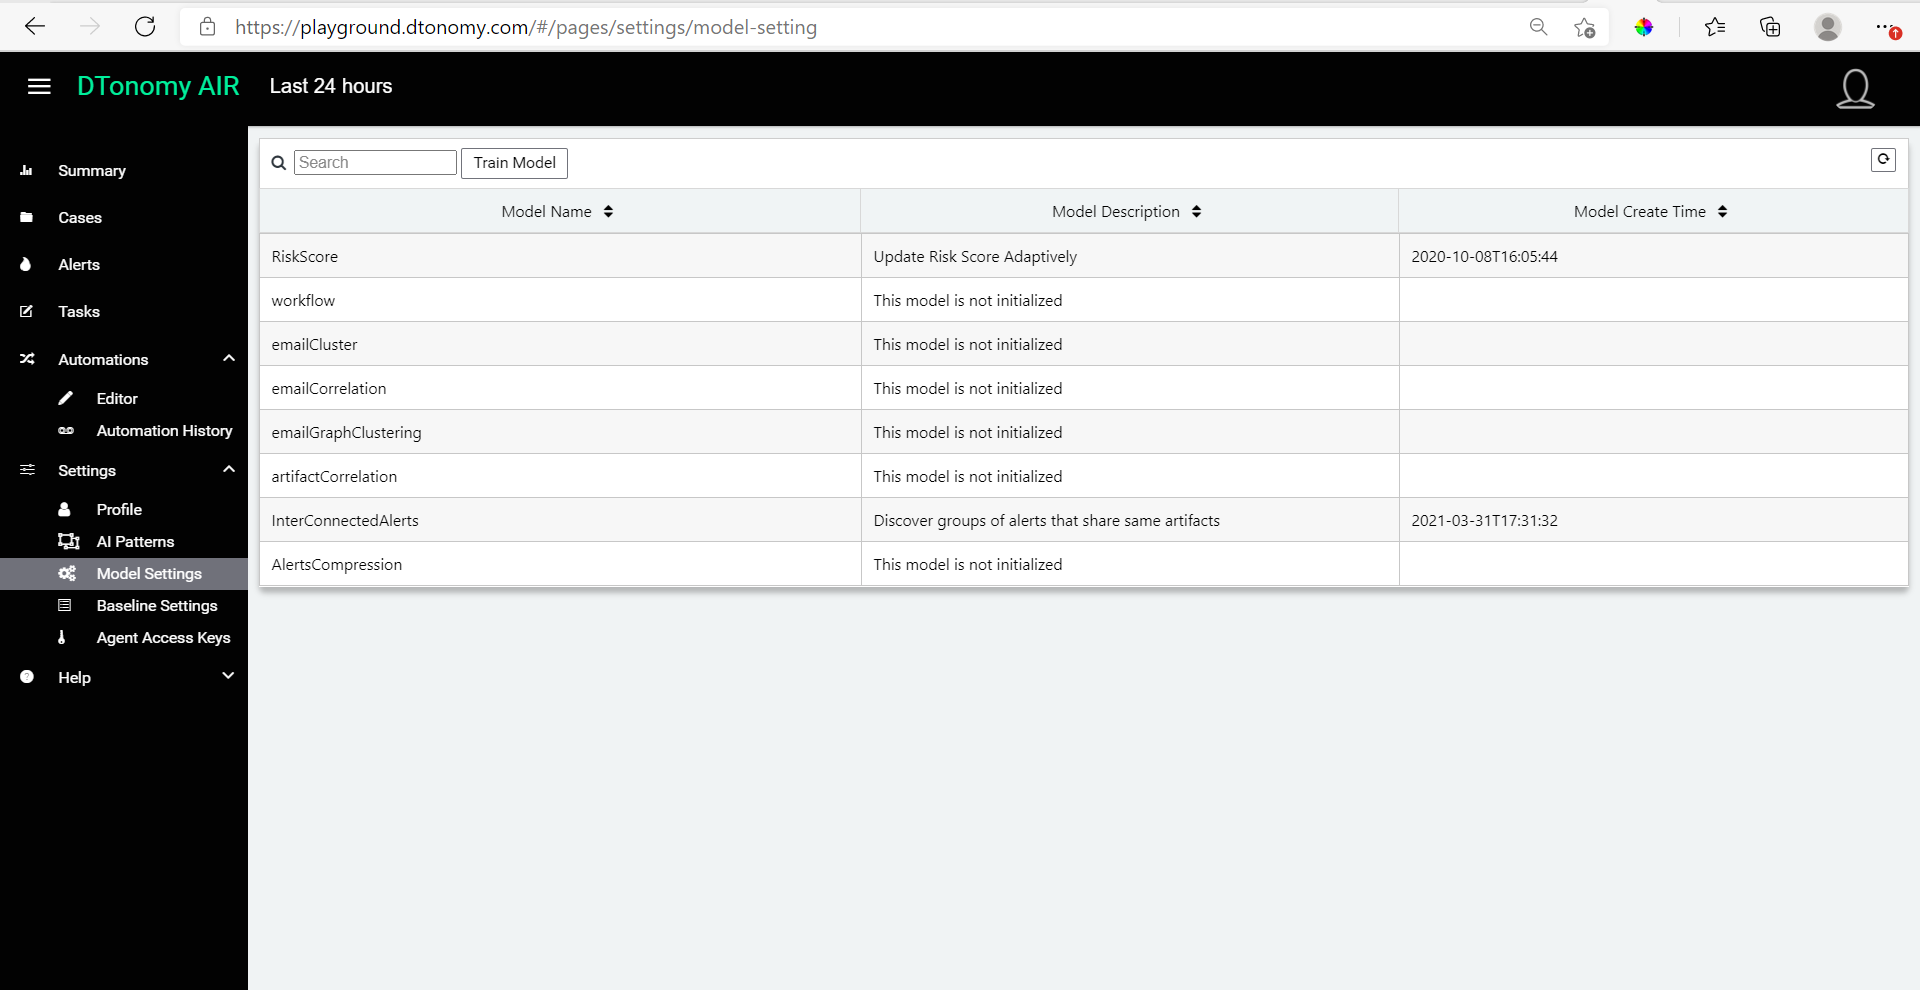
- From within Model Setting, find the “InterConnectedalerts” model and select and enable it. Click “Train” to have DTonomy start learning and automatically generating correlations based on this model, which are called Patterns.
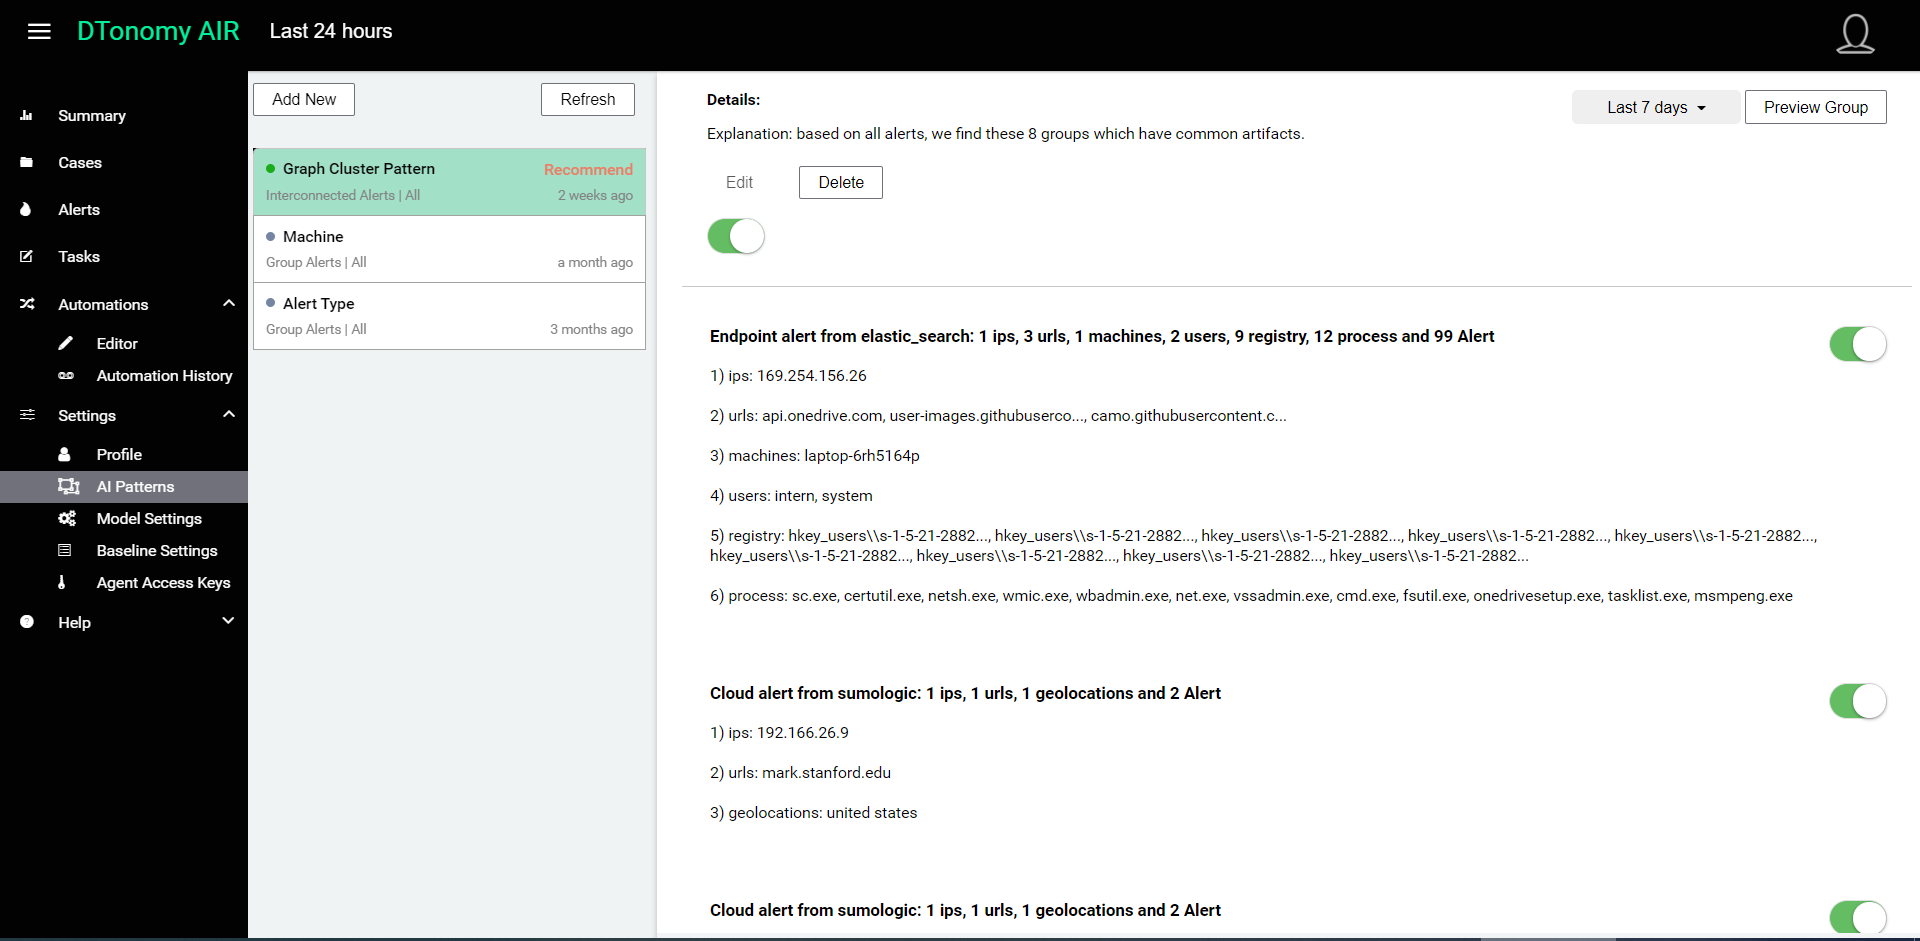
- Click “AI Patterns” under settings, select the top “Graph Cluster Pattern” and you can preview the clustered group by clicking “Preview Group” button on the top right. Toggle interesting groups by clicking the enable/disable icons next to each group.
Step 3: Decision and Response
Now that you’ve selected Patterns which DTonomy will use to automatically create Cases, you will be able to start exploring DTonomy’s Cases thru its Timelines and Visualizations, as well as review its automatically-generated Recommended Actions and initiate Automated Responses.
- On the Cases tab, select any case to explore it. Note that each Case is scored with an aggregate risk score. Scores range from 0-1, with 1 being the highest risk. These scores are automatically generated based on the events incorporated in the pattern that DTonomy detected. For instance, resolving alerts as false positives will cause DTonomy to learn from how you’ve resolved alerts in the past as either true or false positives. From this, DTonomy will adapt the future scores of alerts and cases accordingly to eliminate the regular review of false positives and to highlight known true positives, based on historic trend of resolutions.
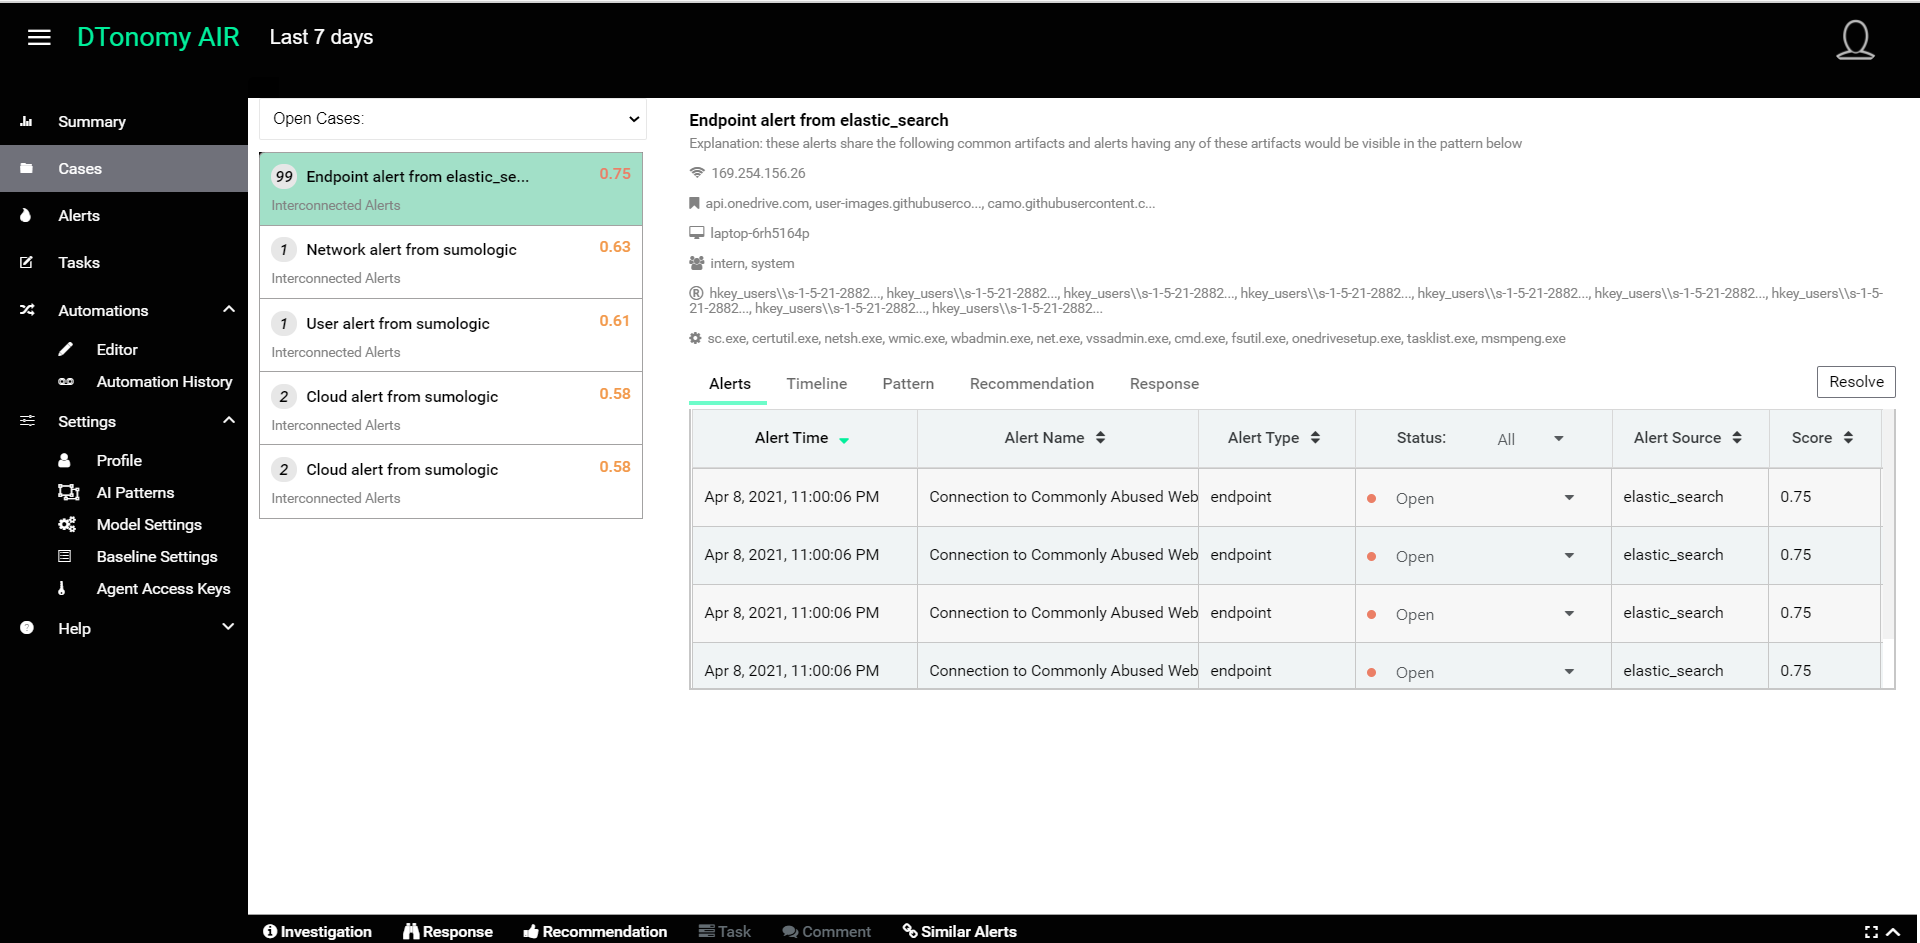
When you select any Case, you see a list of all the alerts, along with their risk scores, which DTonomy has automatically grouped together.
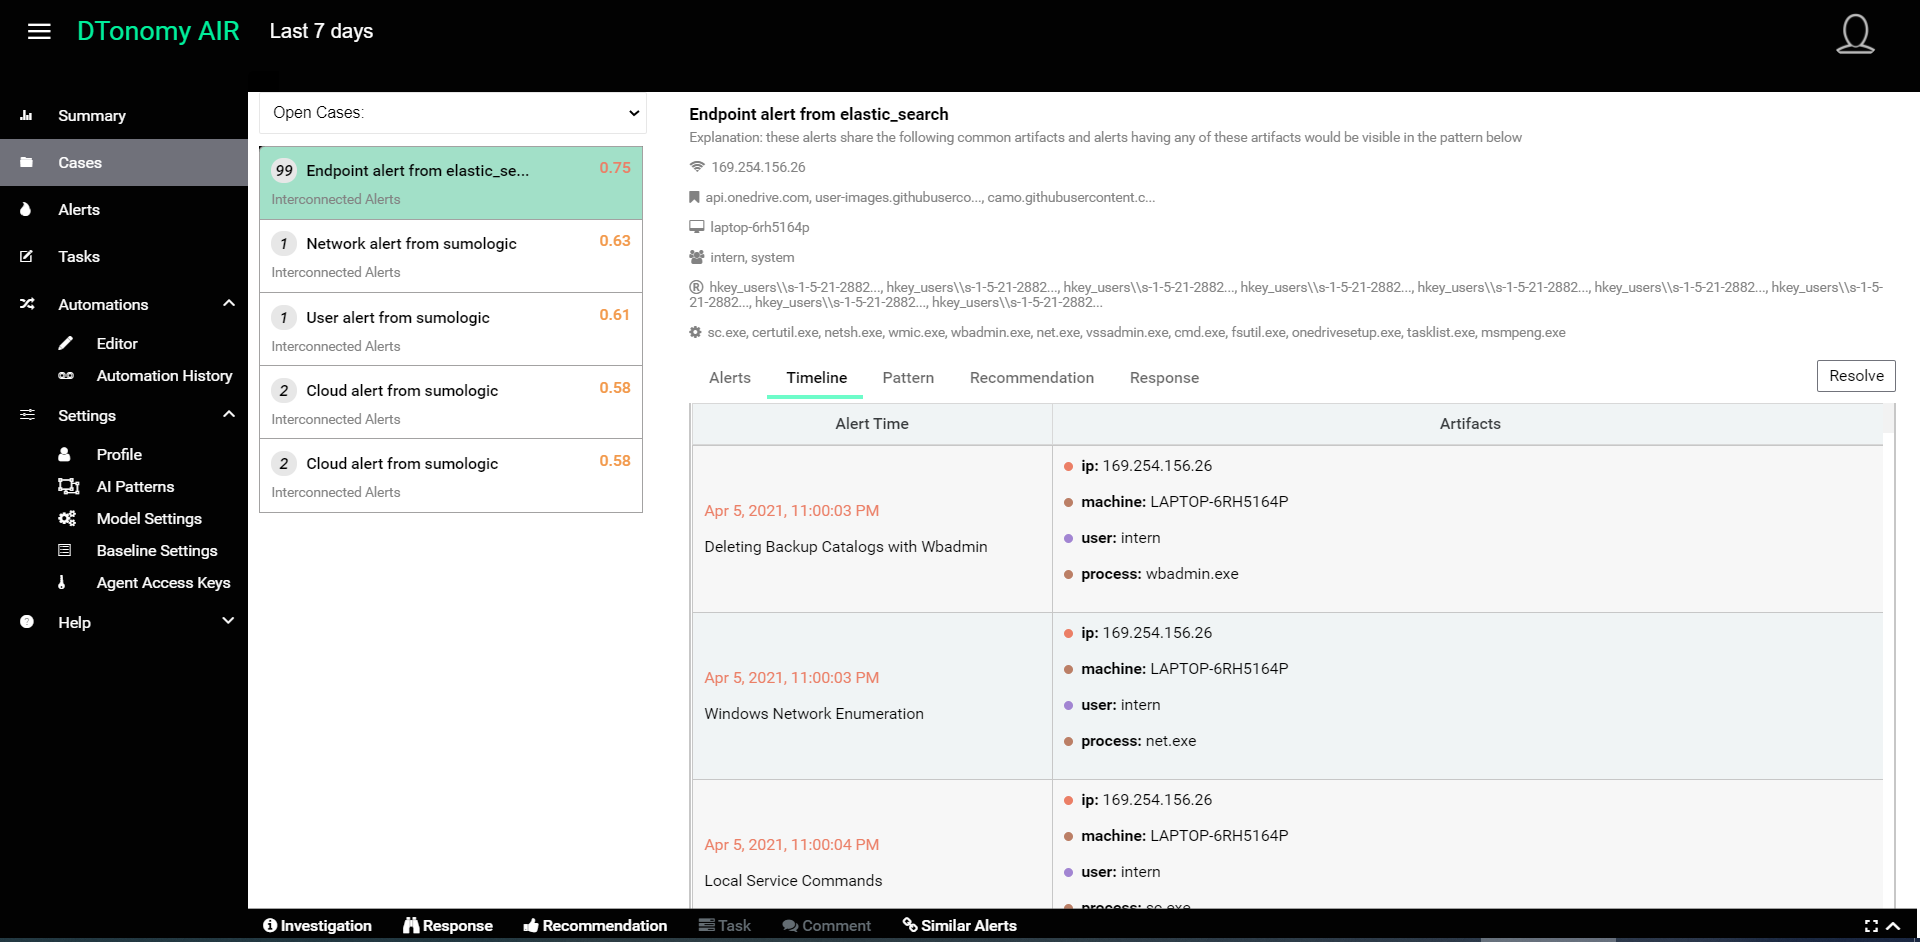
- For any Case, you can click Timeline to view events in time order.
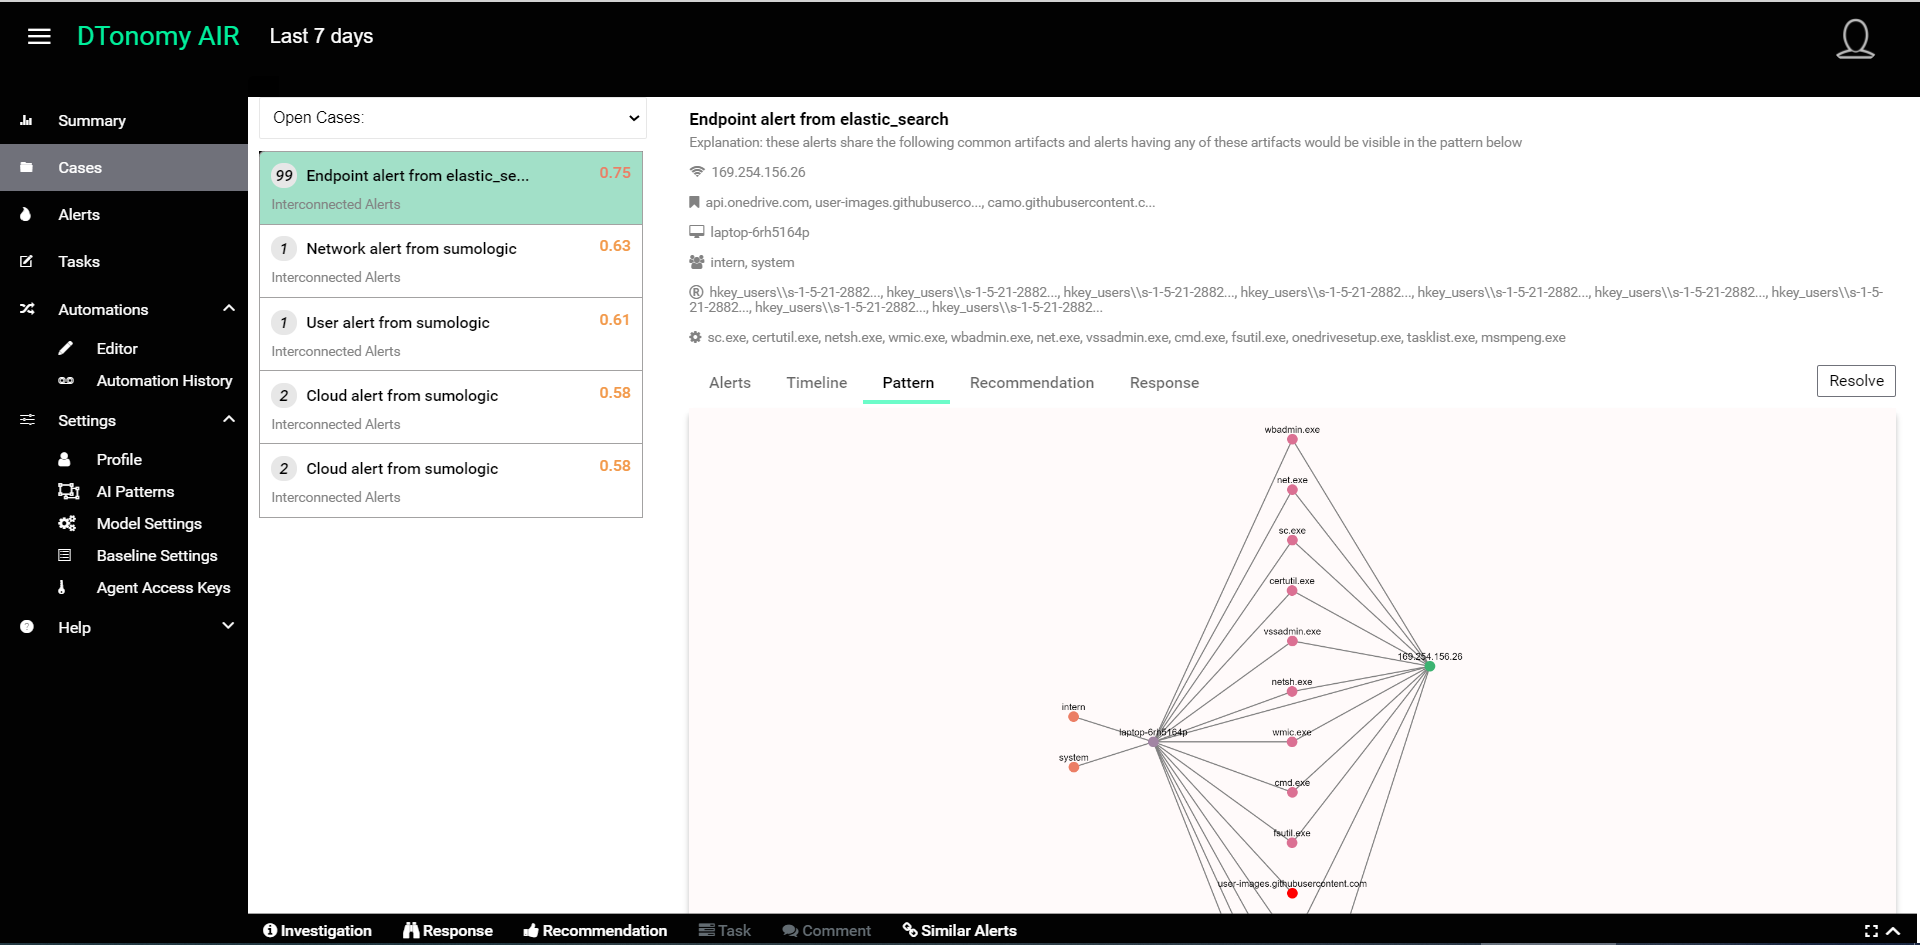
- For any Case, you can select Pattern to view relationships between individual artifacts.
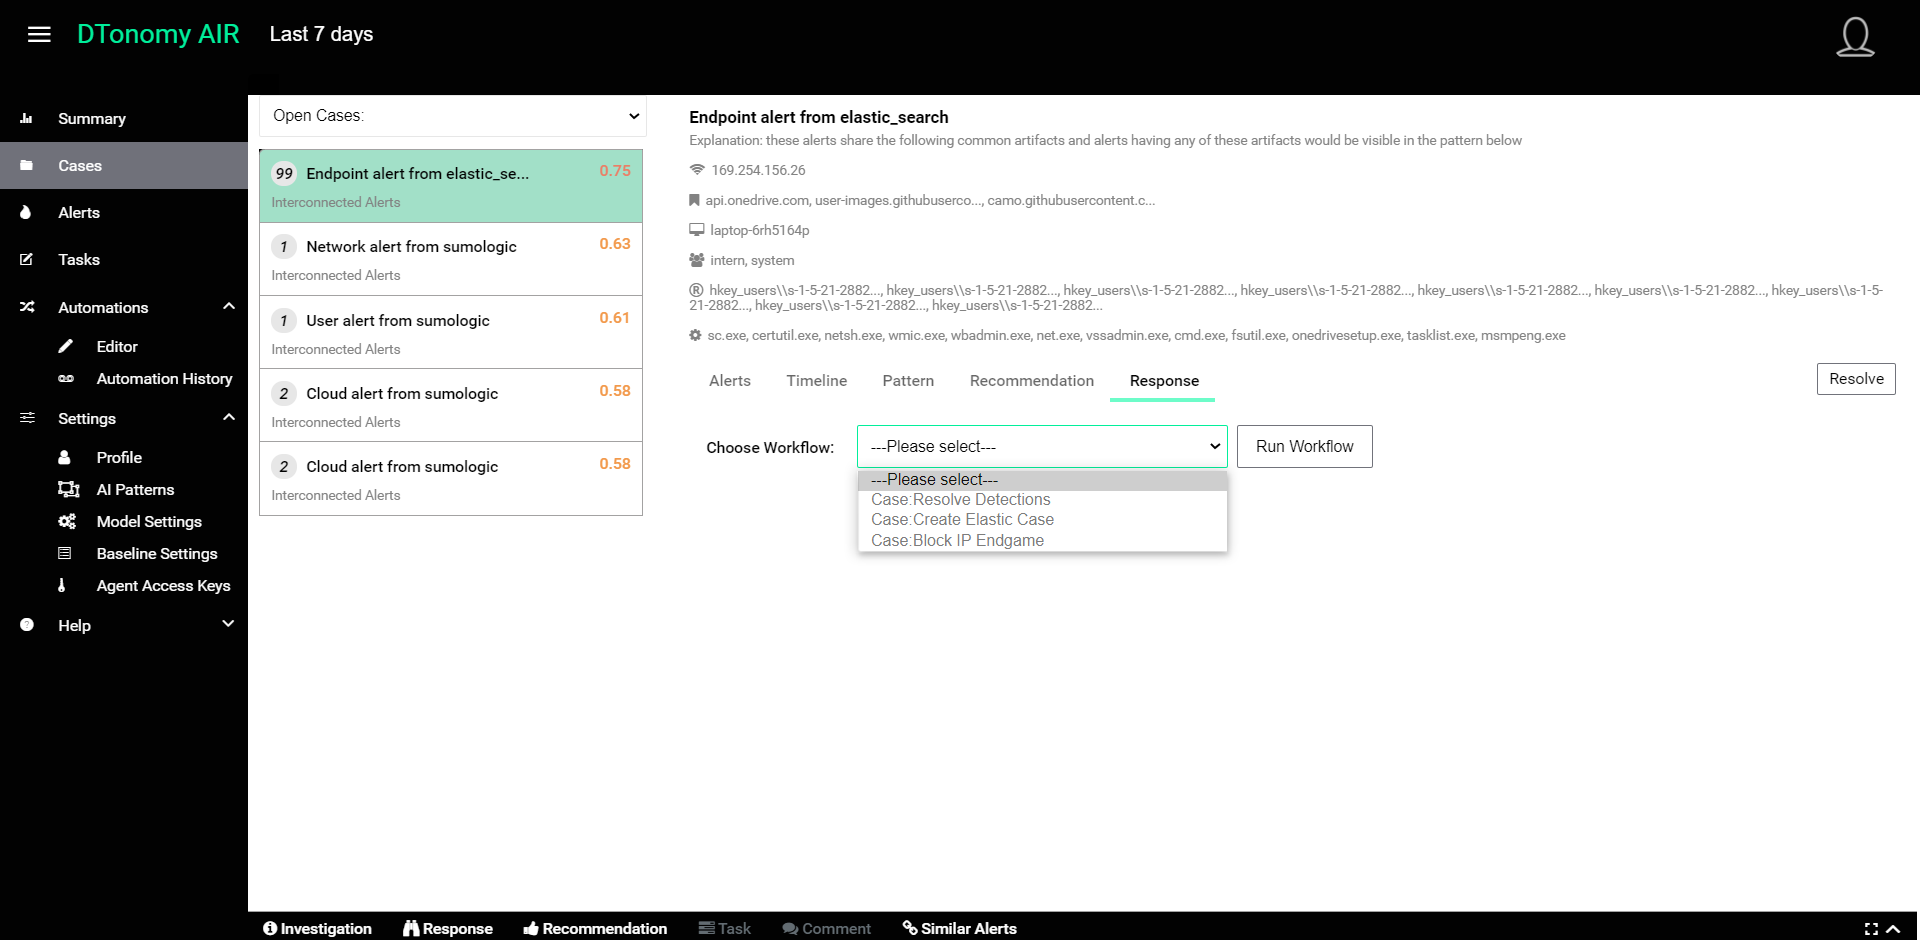
- In Response you can select and run any workflow (aka playbook) in order to automate response actions for the Case. (e.g., block IP)
This concludes the step-by-step tutorial for getting started with DTonomy for Elastic SIEM detections. Thank you for taking the time to walk through these steps. While there are many different use cases which can be automated with DTonomy, we hope this guide was helpful in getting you started. Please let us know what you think and/or if you have any questions or comments at info@dtonomy.com.